

Guide to Forex Trading Seminars in South Africa
Discover top forex trading seminars in South Africa 🇿🇦. Learn how these events boost skills 📈, offer key insights 💡, and guide every trader's journey.
Edited By
James Thornton
Forex trading can feel like trying to navigate a busy taxi rank during peak hour — overwhelming without the right signals. The truth is, picking the right technical indicators sharpens your edge, helping you spot the best moments to buy or sell currency pairs.
Indicators boil down market action into digestible visual cues. They don’t predict the future but highlight patterns, momentum, and potential reversals. Traders in South Africa, dealing with variable liquidity and volatility influenced by global shifts and local events, need tools that cut through the noise.
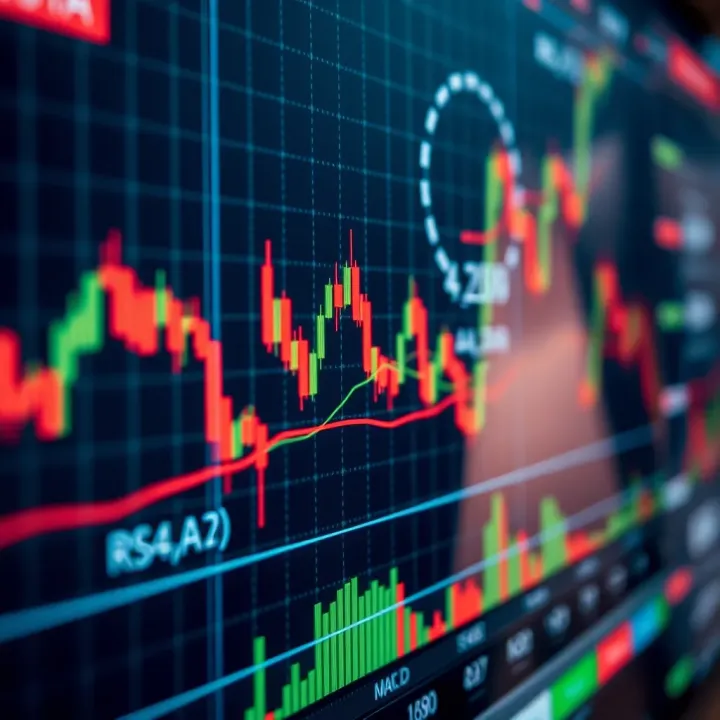
This guide focuses on practical indicators widely used in forex that suit both rookies and seasoned traders. We’ll look at how they function individually, and how combining them can improve your trading accuracy.
Remember: No single indicator offers a crystal ball. Success in forex comes from using indicators alongside sound risk management and market awareness.
Clarity: They turn complex price movements into clearer signals.
Timing: Help identify entry and exit points based on trends and momentum.
Confirmation: Reduce guesswork by confirming signals from price action.
Simplicity: Easy to understand and apply without overcomplication.
Responsiveness: Quick to reflect changes in a fast-moving forex market.
Versatility: Useful across different currency pairs, not just majors like USD/ZAR.
Stay tuned as we break down the best indicators that meet these needs, from moving averages to oscillators, and show you practical ways to combine them for smarter trading choices.
Technical indicators are tools based on price, volume, and sometimes open interest, designed to help traders analyse currency markets objectively. Their main purpose is to simplify the often complex and noisy forex price data, providing insights into trends, momentum, volatility, and potential reversals. For example, a moving average smooths out price fluctuations, helping traders see the general trend direction without getting lost in the day-to-day noise.
These indicators aren't fortune-tellers but aids to better decision-making. Used properly, they can highlight entry and exit points, confirm price movements, or warn against taking positions that go against prevailing market forces. For South African traders dealing with pairs like USD/ZAR or EUR/ZAR, technical indicators serve as handy guides to navigate volatility, especially during times of market uncertainty such as elections or SARB announcements.
At their core, technical indicators are mathematical calculations applied to historical price or volume data. They aim to reveal hidden patterns or trends that aren’t immediately obvious from price charts alone. In practice, they translate raw numbers into signals that suggest when markets might be overbought, oversold, or poised for a breakout — critical for timing trades effectively.
Leading indicators attempt to predict future price moves by signalling potential turning points before they happen. The RSI (Relative Strength Index) is a classic example, often flagging overbought or oversold conditions ahead of price reversals. Conversely, lagging indicators, like the Moving Average Convergence Divergence (MACD), reflect trends after they've begun. They confirm existing market directions but can be slow in following sudden changes.
Choosing when to trust leading versus lagging indicators depends on your trading style. If you prefer early signals and accept more false alarms, leading indicators suit you. For those who favour confirming a trend before entering, lagging indicators offer more caution.
Forex markets operate 24/7 and can react sharply to news and economic data. Indicators help traders avoid emotional reactions by basing decisions on consistent, repeatable signals. They also aid in managing risk by defining clearer entry and exit points, which is vital when trading thinly liquid or volatile pairs like the ZAR or emerging market currencies.
Using indicators effectively can reduce guesswork and emotional bias, making your trading more systematic and disciplined.
No indicator is perfect. Often, price movements can produce signals that look promising but never materialise — these are false signals. Markets can also generate a lot of noise, such as random price swings that cloud the real trend. For instance, during the South African budget season, volatility spikes can cause indicators to trigger misleading alerts, leading to poor trade timing.
Relying purely on indicator signals without considering market context can backfire. Indicators lag price or react to past data, which means they can sometimes suggest trades after the main move has already happened. Instead of blindly following signals, traders should combine indicator readings with price action, news, or broader market sentiment to avoid poor entries or exits.
Indicators work best when viewed as part of a bigger picture. This means using them alongside fundamental factors, such as interest rate changes by the South African Reserve Bank (SARB), political developments, or global economic trends. For example, during Eskom load shedding, forex markets may experience unusual price movements, making a sole reliance on technicals risky. Integrating multiple perspectives ensures balanced, informed trading decisions.
In sum, technical indicators offer valuable clues but need careful use and should be part of a wider toolkit that includes fundamental reading and sensible risk management.
Momentum indicators track the speed and strength of price movements in the forex market. They help traders spot when a currency pair might be speeding up or slowing down, which can hint at possible entry or exit points. Some popular momentum indicators are the Relative Strength Index (RSI), Moving Average Convergence Divergence (MACD), and the Stochastic Oscillator. These tools don’t predict the future but give insight into changes in market sentiment, often highlighting overbought or oversold conditions.
The RSI measures the magnitude of recent price changes to evaluate if a currency is overbought or oversold. Typically ranging from 0 to 100, an RSI above 70 suggests the currency pair might be overbought and primed for a pullback, while below 30 indicates oversold conditions possibly signalling a rebound. For instance, if the USD/ZAR RSI hits 75, traders might prepare for a cautionary exit or short position.
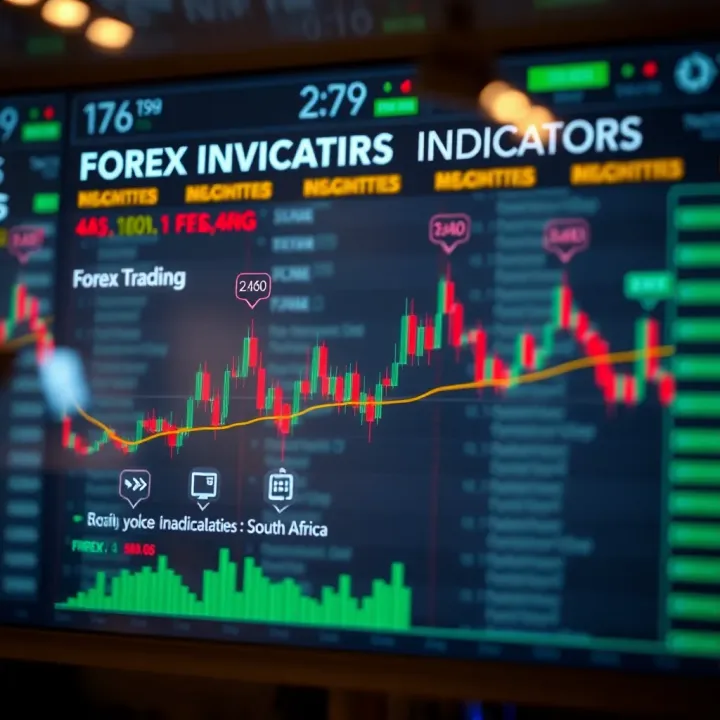
Interpreting RSI values helps traders decide when to enter or exit trades. When RSI crosses above 30 from below, it can be a sign to enter a long position. Conversely, if RSI crosses below 70 from above, it might be time to consider exiting or shorting. However, in strong trends, RSI can stay overbought or oversold for longer, so don’t rely on this signal alone.
In volatile markets, such as during unexpected Eskom load-shedding announcements affecting rand pairs, RSI can fluctuate wildly. To avoid whipsaws, traders should combine RSI with other indicators or look for RSI divergence — where price moves in the opposite direction to RSI — as an early warning sign.
MACD consists of two moving averages (usually 12- and 26-day EMAs) and a signal line (9-day EMA of the MACD line). It shows momentum changes by highlighting the distance between these averages. When the MACD line crosses above the signal line, it generates a bullish signal; crossing below signals bearish momentum.
Spotting crossovers is key to recognising trend shifts. For example, if MACD crosses above the signal line for EUR/USD, that might indicate start of an uptrend. Traders often watch for the MACD histogram to confirm strength—larger bars mean stronger momentum.
But MACD’s lagging nature makes it less effective in sideways markets. During these times, crossovers can produce false signals, leading to losses. To limit risk, pair MACD with other tools like the ADX (Average Directional Index) to confirm trend strength before trading.
This momentum indicator compares a currency’s closing price to its price range over a set period, reflecting potential trend reversals. It oscillates between 0 and 100; readings above 80 suggest overbought conditions, while below 20 indicate oversold.
Divergence between the stochastic oscillator and price often hints at weakening trends. For example, if GBP/ZAR’s price makes a new high but the stochastic doesn’t, it could mean the uptrend is losing steam. Confirming this with volume or RSI helps avoid false alarms.
The stochastic works best on shorter timeframes like 15-minute or hourly charts for active traders looking to catch reversals early. On daily charts, it can help swing traders identify turning points, but with slower reactions. Traders should pick the timeframe that fits their style and risk tolerance.
Momentum indicators provide valuable insight into price action speed and possible reversals, but should always be used alongside other analysis to make well-rounded decisions in the forex market.
Trend-following indicators play a vital role in forex trading by helping traders identify the direction and strength of price movements. These tools simplify the decision-making process by indicating whether a currency pair is moving up, down, or sideways. For traders in South Africa, with local market conditions and volatility, these indicators offer a steady guide amidst unpredictable swings.
Moving averages smooth out price data to reveal the underlying trend. The Simple Moving Average (SMA) calculates the average price over a fixed number of periods, offering a straightforward view of where the market has been. The Exponential Moving Average (EMA), meanwhile, gives more weight to recent prices, making it quicker to respond to changes. For instance, if the 50-day SMA is rising, it signals a generally upward trend; should the price stay above this level, traders might favour long positions.
One popular method uses crossovers between moving averages to generate trade signals. A classic example is the 50-day SMA crossing above the 200-day SMA, often called a "golden cross", which signals a potential bullish trend. Conversely, a "death cross" occurs when the 50-day SMA dips below the 200-day SMA, pointing to possible bearish momentum. EMAs are equally used in crossovers but react faster due to their weighting, which can help traders catch trends earlier but also risks more false signals during choppy markets.
The period settings on moving averages should match a trader’s style. Short-term traders might use a 10- or 20-day EMA to capture quick shifts, while long-term investors lean on 100- or 200-day SMAs for bigger-picture trends. For example, a day trader monitoring 5- or 15-minute charts would adjust periods accordingly, ensuring the moving averages reflect relevant price action. This flexibility means moving averages work across different timeframes and approaches, from scalping to swing trading.
Unlike SMA or EMA, the Average Directional Index (ADX) doesn’t show trend direction; it measures trend strength. The ADX scale runs from 0 to 100, with readings above 25 indicating a strong trend and below 20 signifying a weak or no trend. A South African trader might see the ADX at 30 during a clear uptrend on the USD/ZAR pair, giving confidence to hold onto profitable positions.
ADX works best alongside directional indicators like the +DI and -DI lines. When +DI crosses above -DI and ADX is rising above 25, it confirms a strong bullish trend, guiding traders on entry points. Integrating ADX with moving averages improves timing – for instance, entering long positions when the EMA crossover aligns with a rising ADX. This combination reduces guesswork and filters out weak moves.
In flat or sideways markets, ADX values tend to stay below 20, signalling low trend strength. During such times, trend-following strategies might underperform, and traders should avoid chasing breakouts blindly. Recognising a low ADX reading helps South African traders switch to range-bound tactics or wait for clearer signals before committing to new trades.
Trend-following indicators like moving averages and ADX help traders cut through the noise, focusing on sustained market moves rather than momentary blips. This clarity is especially helpful when navigating currency pairs with varying volatility.
By using these tools thoughtfully, forex traders improve their timing, avoid false signals, and better manage risk in South Africa’s dynamic financial markets.
Volume and volatility indicators offer traders crucial insight into the strength and stability of currency moves. In forex, where actual traded volume is not always transparent due to decentralised trading, these indicators help fill the gap by signalling potential shifts in buyer and seller enthusiasm. Monitoring volume alongside price action gives a fuller picture, while volatility gauges the market’s mood—whether calm or jittery—which often precedes significant breakouts or reversals.
On-Balance Volume (OBV) calculates a running total of volume by adding or subtracting each period's volume based on whether the price closes up or down. This helps confirm whether price moves are supported by volume behind the scenes. For example, if the price of USD/ZAR climbs but OBV stays flat or declines, it hints at weak buying pressure and raises doubt about the sustainability of the uptrend.
On the other hand, when both price and OBV rise in sync, it validates the move’s strength. This confirmation helps traders avoid false breakouts, which are common during volatile sessions on pairs like EUR/USD.
Volume divergence occurs when OBV moves against price direction. For instance, if the price continues to rise but OBV starts dropping, it signals that fewer traders support the rally, often leading to a trend reversal. This early warning is especially useful for catching exhaustion points before turnarounds.
Conversely, if price is falling but OBV trends upward, it suggests underlying buying interest that might soon propel a rebound. Spotting these divergences can give you an edge in timing entries or exits rather than waiting for price action alone.
Consider the GBP/USD pair during a mid-year rally when price advances steadily. If you notice that OBV flattens or dips despite the price rise, it warns of dwindling momentum, perhaps signalling the top is near. Traders in South Africa’s local twin pair, USD/ZAR, also use OBV to assess the validity of moves influenced by geopolitical or commodity shocks, since volume surges tend to accompany key news releases.
Bollinger Bands provide a simple yet effective visual of market volatility by plotting two standard deviation lines above and below a moving average. The bands widen as volatility increases and narrow when the market calms down. This dynamic width immediately tells traders whether the pair they’re watching—say EUR/GBP—is in a quiet phase or gearing up for a big move.
By observing how the price interacts with these bands, you get a vivid picture of price pressure and market sentiment without sifting through raw numbers.
When price breaks through the upper band, it usually indicates strong buying pressure, though that can sometimes be followed by a pullback as the market becomes overbought. Likewise, touching or dropping below the lower band can suggest oversold conditions primed for a bounce.
Traders often look for narrow bands—a squeeze—signalling a period of low volatility that often precedes sharp breakouts. For example, in volatile pairs like USD/JPY, a Bollinger squeeze before the US session often hints at explosive moves once trading volume picks up.
Not all currency pairs behave alike, so it pays to tweak Bollinger Band settings according to the pair’s typical volatility. For high-volatility pairs like AUD/ZAR, wider bands (e.g., three standard deviations rather than two) can prevent false alarms. Conversely, lower volatility pairs such as EUR/CHF might require narrower bands to detect meaningful moves.
Experiment with the moving average period too—shorter periods react faster but may cause more whipsaws, while longer periods smooth out noise but delay signals. The key is to tailor settings to your trading style and the currency’s behaviour, then backtest your choices before applying them live.
Monitoring volume and volatility adds a layer of confidence to your forex trades — it’s not just about price but understanding how the market breathes and moves beneath the surface.
Using more than one indicator at the same time can sharpen your forex trading decisions. Relying on a single tool often leads to false signals or missed opportunities. When combined thoughtfully, indicators can balance each other’s weaknesses and confirm signals, reducing guesswork. This approach is especially valuable in volatile currency markets where price action can be unpredictable.
Most indicators have limitations—they can give misleading signals during sideways markets or sudden spikes. Pairing indicators helps confirm whether a signal is genuine. For instance, a moving average crossover alone might suggest a trend change, but pairing it with an oscillator like the RSI (Relative Strength Index) adds weight when both point in the same direction. Confirmation reduces costly errors and unnecessary trades.
Leading indicators predict potential price moves before they happen but can generate false alarms. Lagging indicators follow price trends but might be late to signal changes. Combining the two types balances proactive entries with confirmation from actual market movement. For example, traders often use the Stochastic Oscillator (leading) alongside moving averages (lagging) to enter trades early while avoiding premature decisions.
Popular combos include the MACD (Moving Average Convergence Divergence) with Bollinger Bands. The MACD shows trend direction, while Bollinger Bands signal volatility and potential breakouts. Another handy pair is the RSI with On-Balance Volume (OBV), which combines momentum with volume confirmation. These setups are straightforward and versatile, suitable for various forex pairs and timeframes.
Your strategy depends on whether you prefer quick scalping, day trading, or longer-term swing trades. Scalpers might favour fast-reacting indicators like the Stochastic or RSI on short timeframes. Swing traders often lean on moving averages and the ADX (Average Directional Index) to identify sustained trends. Understand what kind of trader you are before stacking indicators to avoid overload and confusion.
Before risking real capital, test your chosen indicators on historical data. Backtesting helps identify win rates, false signals, and how your strategy works across different market conditions. Many South African brokers and platforms offer demo accounts with historical data for this purpose. Adjust indicator periods or combinations based on the backtesting results until you find a reliable setup.
Local traders can access platforms like MetaTrader 4 and 5 through brokers such as HotForex or XM, which provide a wide range of built-in indicators and custom scripts. Additionally, platforms like TradingView offer robust charting tools with community-shared indicator strategies. These resources support testing, customising, and fine-tuning your indicator setup without extra costs.
Combining indicators isn’t about piling up tools but selecting complementary ones that support your market view. The goal is to trade smarter, not harder.
Discover top forex trading seminars in South Africa 🇿🇦. Learn how these events boost skills 📈, offer key insights 💡, and guide every trader's journey.

🌍 Explore South Africa's free forex trading options! Learn to start with no fees, choose the right platforms, follow rules, and trade smartly today.
📊 Explore top Forex trading schools in South Africa! Learn how to pick the right one, understand benefits & challenges, plus local market tips. 🇿🇦

📈 Discover how forex trading sessions align with South African time! Learn market hours, volatility, and get practical PDF guides to boost your trades.
Based on 13 reviews