
Forex Trading Guide for South African Traders
💹 Learn how to trade forex in South Africa with clear tips on currency pairs, strategies, risk management, brokers, platforms, and local rules. 🇿🇦
Edited By
Isabella Reed
Forex trading indicators serve as essential tools for analysing currency markets and making smarter trading decisions. These mathematical calculations, plotted onto price charts, help traders identify market trends, potential turning points, and the strength of price movements.
For South African traders, understanding how to read and apply these indicators can make a real difference when navigating the rand's frequent volatility versus major currencies like the US dollar or euro. Trading the forex market effectively involves more than guessing which way a currency pair might move; indicators lend a more objective perspective, helping cut through the noise.
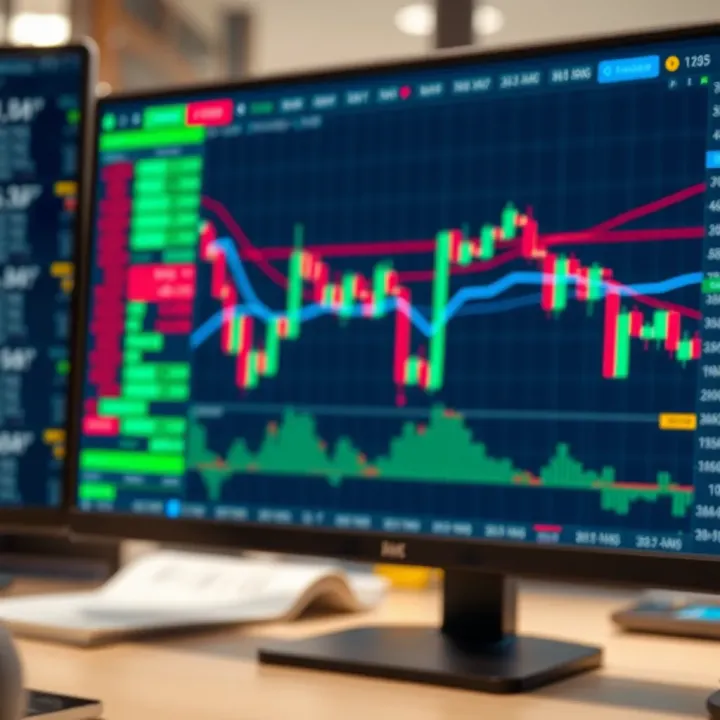
Indicators fall into several broad categories, notably:
Trend indicators, such as moving averages, which show the general direction of prices.
Momentum indicators, like the Relative Strength Index (RSI), that highlight the speed and change of price movements.
Volatility indicators, for instance Bollinger Bands, that measure price fluctuations over a period.
Volume indicators, which track the amount of currency units traded, often offering clues about market interest.
Each plays a different role in a trader’s toolkit. For example, a South African trader might use a 50-day moving average to check whether the rand is generally strengthening or weakening against the dollar while simultaneously using the RSI to spot overbought or oversold conditions.
Effective use of forex indicators depends on understanding what they measure and recognising their limitations. No indicator guarantees success but combining them strategically can increase the probability of making informed decisions.
When starting out, keep it simple. Focus on mastering a few indicators to build confidence, then gradually add more as you get the hang of reading the market signals. Also, remember local factors like Eskom loadshedding or South African Reserve Bank policies may impact forex volatility, so blend technical insights with broader economic awareness.
This guide will unravel how these indicators work and how to pick and pull together the right ones for your trading style, aiming to help you trade the currency markets with more clarity and less guesswork.
Forex trading indicators are mathematical calculations based on historical price, volume, or open interest data. Their purpose is to help traders make sense of market movements by providing signals that can guide buying or selling decisions. In the context of South African traders, understanding these indicators is important given the volatile nature of currency pairs like ZAR/USD or ZAR/EUR, where market swings can be sudden and influenced by local events such as economic announcements or Eskom load shedding.
At their core, forex trading indicators analyse price trends and help forecast potential future directions. Unlike guesswork or gut feeling, indicators rely on past data, processing it through formulas to highlight patterns or momentum. For example, the Moving Average indicator smooths out price data to reveal the overall trend, enabling traders to distinguish between a consistent market rise or sporadic fluctuations. Think of indicators like tools on a dashboard—they offer signals but don’t replace the driver's judgement.
Indicators serve as a second pair of eyes when scouring the charts. They help identify entry and exit points, determine the strength or weakness of a trend, and signal when a currency might be overbought or oversold. This is particularly useful when trading volatile pairs during uncertain times, such as political developments or changes in interest rates. For instance, a South African trader might combine the Relative Strength Index (RSI) to gauge momentum alongside Bollinger Bands to understand volatility, making their decisions more informed and less risky.
Indicators don't predict the future—they show probabilities based on past moves. Using them thoughtfully reduces emotional trading decisions.
Most indicators draw from a few key data points:
Price Data: including open, high, low, and close values over specific intervals (e.g., 1-hour or daily candles).
Volume: shows the number of contracts or units traded, indicating the strength behind price moves.
Time: some indicators factor time explicitly, such as moving averages calculated over a set number of periods.
For example, the Average True Range (ATR) indicator uses high and low price data to measure volatility, which helps traders set stop-loss levels suited to current market conditions. Meanwhile, volume-based indicators like On-Balance Volume (OBV) consider trading activity to confirm whether a price move has genuine backing or is merely a short-term blip.

Understanding what feeds your indicators helps you choose the right tools and interpret their signals appropriately. South African traders who tailor these inputs to their trading timeframe and currency preferences stand a better chance of making money from the forex market.
Forex trading indicators come in various types, each serving a specific role in analysing currency markets. Knowing the key types helps South African traders pick tools that suit their strategy and trading conditions, whether they're eyeing fast intraday moves or longer-term trends.
Moving Averages smooth out price data to highlight the direction of a trend over a set period. For example, a 50-day moving average plots the average closing price for the last 50 days, helping traders cut through short-term noise. In South African rand (ZAR) forex pairs, these averages assist in spotting whether the market is trending upwards, downwards, or sideways. When the current price crosses above a moving average, it can be a signal to buy, and vice versa. It's a straightforward tool favoured by many for its simplicity and practical value.
The Average Directional Index (ADX) measures the strength of a trend without indicating direction. Ranging from zero to 100, a reading above 25 usually signals a strong trend, while below 20 suggests a weak or no trend. This indicator helps traders avoid getting caught in markets lacking clear momentum. For instance, if ZAR/USD is moving sideways, a low ADX warns against trades based purely on perceived price moves, saving you from unnecessary losses.
The Relative Strength Index (RSI) gauges whether a currency pair is overbought or oversold on a scale from 0 to 100. Readings above 70 suggest overbought conditions, meaning a pullback might be near, while below 30 points to oversold levels, indicating potential for a bounce. South African traders use RSI to time entries and exits, especially when volatile factors like commodity prices influence the rand.
The Stochastic Oscillator compares a closing price to its price range over a set period, showing momentum shifts. It generates signals when oscillating above or below specific thresholds, helping detect potential trend reversals. For example, when the stochastic moves above 80, the market may be overbought, suggesting a possible drop soon. Practical traders combine these signals with other analysis tools for better timing.
Bollinger Bands frame price movements with an upper and lower band around a simple moving average, adjusting for volatility. When the bands squeeze tight, it often means low volatility and a potential sharp move ahead. Watching the rand's reaction within these bands can alert traders to breakouts during news events, like SARB interest rate decisions.
The Average True Range (ATR) measures the average distance between highs and lows over a period, providing insight into market volatility rather than direction. ATR helps traders set appropriate stop-loss levels; if, say, the USD/ZAR pair usually fluctuates 200 pips a day, stops set too narrowly risk premature exit.
On-Balance Volume (OBV) accumulates buying and selling volume to show whether volume supports price trends. Rising OBV alongside price increases confirms strength, while divergences can warn of reversals. Though forex volume data varies depending on the broker, OBV still offers hints about interest in a currency pair.
The Volume Rate of Change (VROC) calculates the rate at which volume increases or decreases, helping identify shifts in market participation. A sudden spike in volume often precedes big moves, so South African traders keep an eye on VROC to catch early signs of trend changes, especially in volatile periods offshore.
Combining knowledge of these indicator types lets you build a solid toolbox, tailored to your trading style and goals. No indicator is foolproof alone, but understanding how each reflects market behaviour gives you an edge navigating the unpredictable forex markets.
Choosing the right forex trading indicators plays a vital role in helping you make smarter decisions on the currency markets. Indicators aren’t one-size-fits-all; what works for a day trader can overwhelm a swing trader. Matching your tools to your style keeps things manageable and effective.
Start by clarifying what you want from trading and how much time you dedicate to it. For instance, if you’re a short-term trader looking to catch quick moves during the day, momentum indicators like the Relative Strength Index (RSI) might fit better because they highlight overbought or oversold conditions in shorter timeframes. Meanwhile, if you prefer holding positions for weeks, trend indicators such as the Moving Average help identify longer market directions.
Knowing your timeframe narrows down which indicators serve you best, preventing the headache of irrelevant signals. For example, a Gauteng-based trader juggling full-time work might rely on daily charts and simpler indicators, rather than trying to monitor 5-minute charts packed with noisy data.
More indicators don’t automatically mean better results. It’s tempting to load charts with every tool under the sun, but too many can cloud your judgment. Stick to a handful of indicators that complement each other and don’t duplicate information. Combine a trend indicator with a momentum or volume indicator to get clearer signals.
Let’s say you’re trading the USD/ZAR pair and use the Average Directional Index (ADX) for trend strength alongside the On-Balance Volume (OBV) to confirm if the move has supporting market activity. This pared-down setup offers a clear, actionable picture without overwhelming you.
Aim for indicators that fit your understanding and comfort. If you’re new, start with moving averages or the RSI before exploring complex tools like the Average True Range (ATR) or Stochastic Oscillator.
Overloading your charts with multiple indicators is like trying to eavesdrop on ten conversations at once—your brain can’t focus properly. This often leads to indecision or chasing false signals, which can be costly in volatile markets like forex.
To sidestep this trap, choose indicators that measure different market aspects: trend, momentum, volatility, and volume. Using indicators with overlapping roles offers little benefit and just muddies the water. Regularly review your setup and drop anything that doesn’t consistently improve your decision-making.
The key is to treat indicators as your helpers, not your bosses—use them to support your trade plan, rather than letting them control it.
Selecting forex indicators wisely means understanding your trading style, timeframe, and the market’s rhythm. Keep it simple, stay focused, and avoid drowning your charts in unnecessary noise. This approach helps South African traders, whether in bustling Johannesburg or calmer Cape Town, make decisions that count in the fast-moving currency markets.
Using one indicator alone can sometimes give a skewed picture of the market. Combining indicators helps confirm signals and reduces false alarms, which is crucial for making sound trading decisions in the fast-moving forex market. It’s a matter of cross-checking your findings — much like asking a few neighbours about the weather before heading out instead of relying on just one comment.
Relying on several indicators to confirm a trend adds confidence to your trades. For example, pairing a trend indicator like the Moving Average with a momentum indicator like the Relative Strength Index (RSI) can clarify market direction and strength. When both show a bullish pattern, it’s a stronger signal than just one indicator alone. This approach helps prevent jumping aboard a trend that may be losing steam quickly, something that traders in volatile environments like the rand-zar market appreciate.
Combining indicators from different categories—such as trend, momentum, and volatility—captures a fuller picture of market conditions. A trader might use Bollinger Bands to observe volatility while monitoring RSI for momentum shifts and a moving average to gauge trend. When these indicators align, it suggests a higher probability trade. For instance, a breakout outside the Bollinger Bands confirmed by a rising RSI and a price above the moving average signals a robust upward move.
Here are some practical setups often favoured by traders:
Moving Average + RSI: Confirms both trend direction and momentum strength.
Bollinger Bands + Average True Range (ATR): Tracks volatility changes and potential breakout signals.
MACD (Moving Average Convergence Divergence) + On-Balance Volume (OBV): Combines trend momentum with volume support, useful for spotting genuine moves backed by market participation.
Tip: Avoid cluttering your chart with too many indicators. Combine two or three that complement each other and test them on historical data before committing real funds.
In sum, combining forex indicators smartly can help traders filter out noise and trade with increased confidence. South African traders, in particular, benefit from understanding how to balance these tools efficiently amid local market quirks like loadshedding and exchange rate fluctuations. Having a clear plan on which indicators to combine—and why—makes all the difference in a competitive trading space.
💹 Learn how to trade forex in South Africa with clear tips on currency pairs, strategies, risk management, brokers, platforms, and local rules. 🇿🇦
📈 Discover how Forex trading hours affect South African traders, spot peak volatility times, and get tips to boost your trading strategy effectively.

📈 Discover essential forex trading tools for South African traders! From charting software to risk control, get the resources to trade confidently today.
Discover effective forex trading strategies tailored for South African traders 🇿🇦, covering analysis, risk management, and smart trading plans 📈💡
Based on 9 reviews