
High Profit Candlestick Patterns Guide
📈 Learn to spot high profit candlestick patterns and boost your trading skills with practical tips and resources tailored for South African traders. 🇿🇦
Edited By
Isabella Morgan
Bullish candlestick patterns serve as vital signals for traders aiming to spot potential price rises in various markets, including the JSE and commodities trading in Mzansi. These patterns reveal when buyers are gaining momentum, often indicating a shift from a downtrend to an uptrend or strengthening an existing upward move.
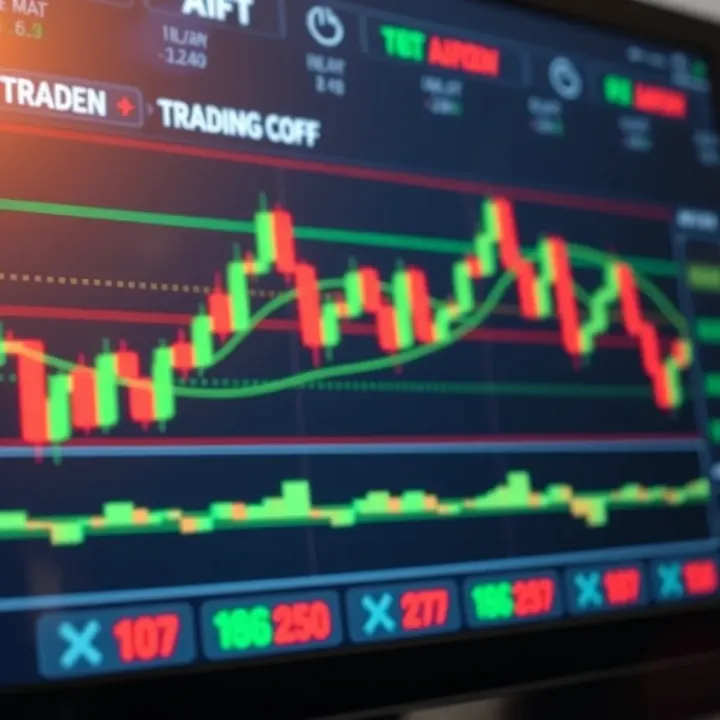
Candlestick charts display price information through individual candles representing specific time periods, such as a day or an hour. Each candle shows the opening, closing, high, and low prices, forming distinct shapes traders analyse to interpret market sentiment.

Key point: A bullish candlestick pattern typically features a close price higher than the open, signalling buying pressure.
Familiarity with common bullish patterns helps traders make sharper calls on entry and exit points. For example, the hammer candle, with its long lower shadow and small body near the top, often suggests rejection of lower prices and a likely reversal upwards after a downtrend. Another popular one is the morning star, a three-candle formation signalling a bottom and potential rally.
Understanding these patterns is more than spotting shapes; it involves context and confirmation. A hammer in isolation might not be as convincing without volume support or additional confirming candles.
Combine bullish patterns with technical indicators such as RSI or moving averages to reduce false signals.
Watch for these patterns near key support levels, increasing the chance of a meaningful bounce.
Consider market conditions and news events that can impact buyer strength.
By mastering bullish candlestick patterns, traders sharpen their ability to anticipate market shifts, improving timing and risk management. This skill proves especially useful amid South Africa's sometimes volatile markets, where identifying early signs of strength can protect capital and enhance returns.
Understanding candlestick charts is fundamental for traders aiming to read market sentiment at a glance. These charts provide a visual summary of price movements over a specific time frame, helping you identify turning points and potential trading signals. For South African traders navigating local equities on the JSE or forex markets involving the rand, mastering this tool can improve timing and decision-making.
Candlestick charts originated in Japan during the 18th century, initially developed by rice traders to track price fluctuations. Their effectiveness lies in how they condense a day’s trading into easily interpretable shapes, reflecting open, high, low, and close prices. This historical method remains relevant today, as many modern trading platforms, including South African brokerages, offer candlestick charting.
A single candlestick is made up of a body and shadows (“wicks”). The body shows the difference between the opening and closing price. Shadows indicate the highest and lowest prices during the session. For example, a long lower shadow with a small body near the top can signal buying interest after a selloff.
Reading candlestick colours or fills gives quick clues about market direction. A bullish candle usually closes higher than it opened, often presented as a hollow or green bar, indicating buyer strength. Conversely, a bearish candle closes lower, typically shown as filled or red, signalling selling pressure. Recognising these helps traders spot momentum shifts without digging through volume or news data.
Patterns formed by single or multiple candlesticks highlight shifts in supply and demand dynamics. These shapes matter because they often precede price moves, giving traders a heads-up on potential reversals or continuations. For instance, the “hammer” pattern suggests a possible bullish reversal after a downtrend, while a “shooting star” indicates bearish potential.
Bullish signals arise when patterns indicate growing buyer control, often encouraging traders to enter long positions or add exposure. Bearish signals warn of impending declines or increased selling pressure. Distinguishing these signals in real time helps with managing risk and setting strategic entry or exit points.
However, no pattern can guarantee profits. Their reliability depends on context such as volume confirmation, overall trend, and market conditions. False signals can mislead, causing premature buys or sells. That’s why cautious traders combine candlestick insights with other indicators, ensuring a more balanced market view before acting.
Candlestick patterns offer valuable insights but require careful interpretation within broader market context to avoid costly errors.
By grasping the basics of candlestick charts and their role in signalling, traders build a solid foundation to analyse bullish patterns effectively and trade with greater confidence.
Recognising key bullish candlestick patterns is vital for traders looking to spot potential buying opportunities early. These patterns offer practical insight into market sentiment and often precede price reversals or the continuation of upward trends. Knowing which patterns to watch and their specific nuances helps you make sharper trading decisions and manage risks more effectively.
The hammer and hanging man look quite similar but serve different roles depending on where they appear in a trend. A hammer emerges after a downtrend, signalling buyers' comeback, with a small body and a long lower wick indicating strong rejection of lower prices. On the flip side, a hanging man appears after an uptrend, carrying a warning that sellers may be stepping in despite a generally bullish picture.

For example, seeing a hammer form on a JSE-listed stock like Sasol after a series of falling candles can hint buyers are getting ready to push prices higher. However, spotting a hanging man at the top of a rally in Aspen Pharmacare might suggest the rally is losing steam.
The inverted hammer also appears after a downtrend and, like the hammer, suggests a potential bullish reversal. It has a small body near the bottom with a long upper wick, implying buyers tried to push prices up during the session but faced resistance. If this pattern appears near strong support levels, it carries more weight.
Imagine Rainbow Chicken shares falling over several sessions when suddenly an inverted hammer forms close to a known support zone. This could mean a shift in momentum, with buyers looking to regain control despite earlier selling pressure.
A marubozu is a single candle with no wicks on either end, reflecting strong conviction by buyers when appearing bullish (closing near the high). It signals a clear and decisive move, often marking the start or continuation of a strong trend.
For instance, a bullish marubozu on Naspers during a rally suggests sustained buying interest without hesitation from sellers. Traders often treat this as a strong confirmation of bullish sentiment and may enter positions accordingly.
This pattern involves two candles: a smaller bearish candle followed by a larger bullish candle that completely 'engulfs' the previous one. It shows buyers taking control after sellers' weakness, suggesting a shift in momentum.
Consider trading Shoprite shares that have been trending downwards when suddenly a bullish engulfing pattern appears. This could indicate a convincing reversal, signalling a chance to buy before the price climbs.
The piercing line pattern consists of a bearish candle followed by a bullish candle that opens lower but closes well above the midpoint of the previous candle. It points to buyers pushing back strongly after initial selling pressure, often seen as an early bullish sign.
If such a pattern emerges on a share like Sasol just after a dip, it might hint at a bounce back, especially if supported by volume, encouraging cautious entry.
The morning star is a three-candle pattern signalling a potential trend reversal. It starts with a long bearish candle, followed by a small-bodied candle showing indecision, and finishes with a strong bullish candle closing well into the previous downtrend. This setup suggests sellers are losing power and buyers are stepping up.
For example, if Gold Fields shows a morning star pattern after a downtrend, it can alert traders to the possibility of an upward move, especially when combined with other signals like support levels or volume spikes.
Recognising these bullish candlestick patterns in real time helps you anticipate market moves and make informed decisions. Remember, context matters—confirm patterns with other tools and market conditions to avoid false signals.
Understanding these patterns not only improves your timing but also your confidence when entering or exiting trades, which is key in the fast-changing financial markets we see today.
Bullish candlestick patterns offer useful clues about potential price rises, but interpreting them correctly depends on understanding the broader market context. Without considering factors like volume, overall trend, and support levels, these patterns can mislead traders, especially in volatile or sideways markets common on the JSE and other exchanges. This section explains how confirming signals and combining patterns with other tools improves your trading edge.
Volume plays a key role in validating bullish candlestick patterns. For example, a bullish engulfing pattern forming on weak volume may not carry the same weight as one on high volume, where increased buying interest supports the price move. When volume spikes alongside a bullish pattern, it suggests real demand, not just random price swings. This is especially relevant during periods of market uncertainty, such as around local events or earnings announcements.
Alongside volume, analysing the existing trend and key support levels helps confirm whether a bullish pattern signals a genuine reversal or just a pause. If a hammer forms near a well-established support line—say R350 on a mining stock—it could mark a strong buying opportunity. However, spotting the same pattern in a strong downtrend without a nearby support reduces its reliability. Knowing the trend context prevents chasing false hope when the dominant momentum is still bearish.
Misreading candlestick patterns without these confirmations often leads to false signals. For instance, a piercing line pattern on daily charts might hint at a bounce, but if the broader market sentiment remains negative and volume is low, you might end up entering too early. It pays to wait for additional evidence before acting.
Moving averages help smooth price action and highlight trend direction, making them handy alongside candlestick patterns. A bullish pattern forming just above the 50-day moving average, which previously acted as resistance, strengthens the buy case. Conversely, if the pattern emerges below a declining 200-day moving average, caution is prudent.
The Relative Strength Index (RSI) indicates oversold or overbought conditions. For example, spotting a morning star pattern when the RSI is below 30 suggests the asset is oversold and ripe for a rebound. This extra layer cuts down on chasing false breakouts in crowded markets like the forex or cryptocurrency scene.
Fibonacci retracements mark potential support and resistance levels based on price swings. When a bullish candlestick pattern aligns with a 61.8% retracement level after a pullback, it adds confidence that buyers may step in. Traders often use this to time entries more precisely, especially for volatile shares listed on the JSE.
Context is everything. Bullish candlestick patterns become far more reliable when you check volume, trend, and complementary indicators before making trading decisions.
Applying these checks helps you avoid common pitfalls and gives your trading strategy more depth and resilience.
Applying bullish candlestick patterns within your trading strategy isn’t just about spotting them on a chart; it’s about using them as a reliable tool to make informed entry and exit decisions. These patterns signal potential buying opportunities when confirmed properly, helping you time your trades more effectively. However, integrating them without a clear plan or risk management can quickly lead to costly mistakes.
Defining buy signals usually begins with identifying clear bullish patterns such as a bullish engulfing or a morning star at a support level. For example, if the price forms a hammer candle after a downtrend while the volume increases, this could signal a reversal, suggesting a good entry point. The confirmation can be strengthened by other indicators like moving averages or RSI showing oversold conditions. However, rushing into a trade immediately after spotting a pattern without waiting for that confirmation can lead to false signals.
Setting stop-loss limits is vital to protect your capital when the market moves against you. Typically, the stop loss should be placed slightly below the low of the bullish candlestick pattern for long trades. For instance, after a bullish engulfing candle forms, setting a stop-loss just below its wick limits your losses if the reversal fails. This approach is particularly helpful in volatile markets where prices can swing widely, preventing mild pullbacks from wiping out your position.
Taking profit considerations depend on your risk appetite and market conditions. Some traders prefer setting profit targets at nearby resistance levels or round numbers, while others trail their stop-loss to lock in gains as the price moves up. For example, if a morning star pattern occurs near a strong resistance zone, it might be wise to take profit just before that level. Always plan your exit in advance rather than holding on blindly, as markets can reverse unexpectedly.
Position sizing helps you manage how much of your capital to allocate per trade, balancing potential gains with risk. A common rule is risking only 1-2% of your trading account on any one trade. So, if you’re using a bullish candlestick pattern for entry, calculate your position size based on the distance between your entry price and stop-loss level. This ensures even several losing trades won’t heavily dent your portfolio.
Using risk-to-reward ratios means comparing how much you stand to gain if the trade works versus what you could lose. Aim for at least a 1:2 ratio, meaning the potential reward is twice your risk. For example, if your stop-loss is R100 below entry, look to set your profit target at least R200 above it. This mindset helps you stay profitable overall even if less than half of your trades succeed.
Adjusting strategy for market conditions is crucial because candlestick patterns don’t work in isolation. During strong trending markets, bullish patterns may lead to quick gains, whereas in choppy sideways markets, the same patterns can misfire. If, say, Eskom loadshedding disrupts market confidence or liquidity drops during holidays, small reversals might fail to materialise. Adapt by using additional confirmation tools or reducing trade size when conditions seem uncertain.
Successful trading with bullish candlestick patterns requires disciplined planning — precisely defining entries, sticking to stop-loss levels, and managing risk to protect your capital. Patterns only tell part of the story; how you apply them shapes your results.
Misunderstanding bullish candlestick patterns can cost traders dearly. This section addresses some of the most common pitfalls and widespread myths that often lead to poor trading decisions. Getting these right helps you interpret market signals more realistically and improves your overall trading strategy.
Over-reliance on single patterns: Relying on one bullish candlestick pattern alone is like judging a braai based on a single sausage — it doesn't tell the full story. Patterns like the Hammer or Bullish Engulfing should be validated within broader market trends and volume changes. For instance, a Hammer forming after a prolonged downtrend with rising volume tends to hold more weight than one appearing out of the blue during sideways price action.
Ignoring market environment: Many traders jump the gun by spotting a bullish candle and rushing in without considering the bigger picture. Context matters — is the market in a solid downtrend, sideways channel, or mild uptrend? Ignoring support and resistance levels or economic news can cause false interpretations. For example, a Piercing Line pattern near a major resistance often fails to spark a sustained rally.
Confusing similar-looking patterns: Some bullish and bearish candles look alike at a glance, which can spell trouble if you don’t distinguish them carefully. The Hammer and Hanging Man share shapes but have opposite implications depending on the trend. Likewise, a Doji can sometimes mimic indecision, but its interpretation shifts if it appears during an uptrend or downtrend. Training your eye and confirming with other indicators is key to avoid costly mix-ups.
Patterns guarantee profits: There’s a stubborn myth that spotting a bullish candlestick pattern means a sure win. The truth? No chart pattern assures profits. Markets are unpredictable and influenced by numerous factors beyond what candlesticks show. Treat these patterns as one tool among many rather than a crystal ball.
Patterns work the same across all markets: Candlestick patterns might translate differently depending on the asset class or market. For example, patterns on JSE shares might behave differently compared to forex pairs or cryptocurrencies. Liquidity, volatility, and trading hours affect pattern reliability, so blindly applying the same rules everywhere can backfire.
Waiting too long for perfect conditions: Some traders wait ages for a textbook-perfect bullish pattern before entering. But markets rarely serve perfect setups on a silver platter. Excessive hesitation can mean missing out on solid trading opportunities. Learning to recognise good-enough signals and managing risk accordingly tends to be more effective than holding out for ideal conditions.
Keep in mind, bullish candlestick patterns are guides, not gospel. Understanding their limits helps you navigate the markets with greater confidence and avoids costly mistakes.
📈 Learn to spot high profit candlestick patterns and boost your trading skills with practical tips and resources tailored for South African traders. 🇿🇦

📊 Understand key chart patterns in trading with this practical guide. Learn how to spot formations and predict price moves, tailored for South African markets.

📚 Explore top forex trading books to master strategies, market analysis, risk management & trading psychology for South African traders aiming to improve and succeed.

📈 Learn to spot key forex trading patterns that reveal price moves, avoid common traps, and factor in market psychology for smarter decisions in volatile forex markets.
Based on 8 reviews