

Forex Trading Patterns Explained
📈 Learn to spot key forex trading patterns that reveal price moves, avoid common traps, and factor in market psychology for smarter decisions in volatile forex markets.
Edited By
Benjamin Foster
Candlestick patterns are a fundamental part of forex trading that help you read market sentiment and make smarter trade decisions. Originating in Japan centuries ago, these visual chart patterns represent price movements over a set period, showing the opening, closing, high, and low of each trading session.
In the South African forex market, understanding these patterns adds an edge amidst volatile conditions influenced by factors like rand fluctuations, global commodity shifts, and Eskom’s load-shedding cycles. Since forex trading heavily relies on timing entry and exit points, recognising candlestick signals offers you clearer clues about potential reversals or continuations.

Bold or long-bodied candles suggest strong buying or selling pressure, while candles with long wicks highlight rejection at certain price levels. For example, a bullish engulfing pattern, where a green candle fully covers the previous red one, often signals a shift towards buying momentum. Conversely, a shooting star pattern with a long upper wick may warn that buyers are losing control and sellers might take over soon.
Learning to identify these patterns isn't about guesswork—it’s about reading the story the market tells through price action.
Here's what you should focus on when starting out:
The context of patterns: Look at recent price trends to see if a pattern supports a reversal or continuation.
Volume confirmation: Higher trading volume alongside a pattern adds credibility.
Combine with other tools: Use indicators like moving averages or support and resistance levels for better validation.
Keep in mind, no single candlestick pattern guarantees success. It’s about interpreting them with care, especially in the South African context where unexpected news or events can sway the rand sharply. Practice spotting these patterns on platforms used locally, like MetaTrader 4 or 5, or through brokers licensed by the Financial Sector Conduct Authority (FSCA).
In essence, mastering candlestick patterns improves your ability to read the forex market’s pulse and react swiftly. This skill, paired with solid risk management, can boost your trading performance significantly.
Understanding candlestick patterns is a fundamental skill for forex traders aiming to read the market with more confidence. These patterns offer visual cues about price movements, helping traders decide when to enter or exit trades. In fast-moving markets like forex, recognising such signals can prevent costly mistakes and improve timing.
Candlestick charts display price information using rectangular bars — called candles — showing the opening, closing, high, and low prices for a specified time frame. Each candle gives a snapshot of market activity within that period. For example, a one-hour chart will have a new candle every hour. The body of the candle shows the range between opening and closing prices, while wicks reveal the extremes (highest and lowest prices traded).
This simple visual format makes it easy to spot shifts in price momentum. Instead of interpreting pure line charts, traders see where buyers or sellers took control during the session. For South African traders using platforms like MTN's Vula or Vodacom's MyBroadband for data, efficient visuals save bandwidth while packing valuable info.
Candlestick patterns form when individual candles combine in particular ways indicating potential trend changes or continuations. For example, a 'hammer' pattern typically appears at the bottom of a downtrend, signalling that buyers might be gaining steam.
These patterns reflect the tug of war between bulls and bears. If a few candles show long lower wicks but close near the high, it hints that sellers tried to push prices down but buyers reclaimed the ground. Traders use this insight to anticipate if a reversal or pause might occur.
Compared to line or bar charts, candlestick charts pack more information into each point. They reveal not only price levels but also market psychology. This richer detail helps traders avoid guessing the market mood.
Moreover, candlestick patterns are easy to spot in real-time, which is essential for forex traders reacting to fast-moving currencies like USD/ZAR. While bar charts show price ranges, candlesticks add clarity with colour coding and body shapes, reducing interpretation errors.
One of the main draws of candlestick patterns is their ability to mark potential entry or exit points. For instance, spotting a bullish engulfing pattern after a downtrend can signal a good time to buy, while an evening star might warn to sell.
These patterns offer a visual shorthand that helps traders act before a larger price move happens. Rather than waiting for confirmation from multiple indicators, traders can make quicker, more informed decisions.
Candlestick patterns don't just show prices; they hint at the sentiment behind them. Are traders feeling bullish, bearish, or indecisive? For example, long upper wicks indicate selling pressure despite higher prices pushed earlier.
This insight is valuable in volatile pairs like EUR/ZAR or GBP/ZAR where local economic news can quickly sway sentiment. Recognising when nerves or optimism dominate helps traders avoid false starts and ride real trends.
Candlestick patterns aren't tied to any one market and work well in South African conditions. Whether you’re trading at home on a platform like IG Markets South Africa or from a mobile device on MTN's network, candlestick signals remain consistent.
In fact, given the volatility often seen in emerging markets like ours, these patterns become even more useful. They help navigate sudden price moves during times of political uncertainty, SARB announcements, or changes in the rand.
Candlestick patterns give you a practical lens to understand and act on forex price action, crucial whether you trade ZAR pairs or global currencies.
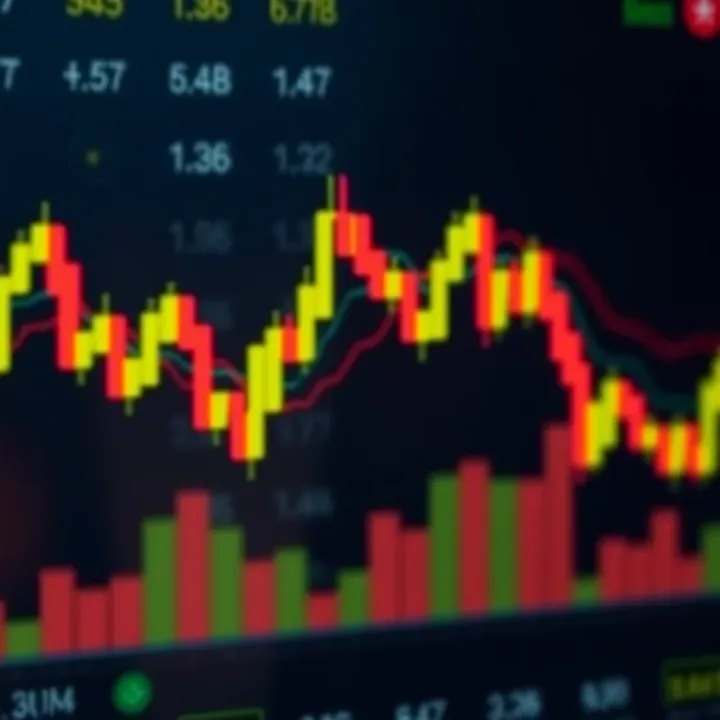
Having a firm grasp on these basics sets the stage for mastering more complex patterns and successfully applying them in real-world trading.
Bullish candlestick patterns play a key role in forex trading by signalling potential upward price movements. For traders, recognising these patterns can mean identifying opportunities to enter the market before an upswing. These patterns highlight shifts in market sentiment from sellers to buyers, providing practical clues especially when combined with other indicators.
The Hammer and Inverted Hammer are single-candle patterns recognised by their distinctive shapes. A Hammer has a small body near the top of the candle with a long lower wick, suggesting buyers pushed the price back up after sellers drove it down during the session. The Inverted Hammer reverses this with a small body at the bottom and a long upper wick, showing initial buying pressure that faded but may still indicate a shift in momentum.
Both patterns are more meaningful after a downtrend or pullback, signalling a possible reversal where bulls regain control. In an uptrend, spotting an Inverted Hammer can suggest slowing momentum, while a Hammer confirms strong support. Traders use these as warning signs or entry points, combining them with volume or support levels to avoid false signals.
Imagine the USD/ZAR pair dropping sharply after a period of gains. A Hammer appears near a known support level, with increased trading volume, signalling buyers stepping in. This might prompt a trader to open a long position anticipating a rebound. Similarly, an Inverted Hammer after a slight dip in EUR/USD could hint that bears are losing strength before the price resumes its rise.
The Bullish Engulfing pattern involves two candles: a small bearish candle followed by a larger bullish candle that completely covers (engulfs) the body of the first. This visual suggests that buyers have overwhelmed sellers, asserting control with notable strength.
This pattern is widely regarded as a strong bullish reversal signal, especially when found at the bottom of a downtrend. The engulfing candle’s size and close above the previous candle’s open confirm a clear shift in momentum, making it a reliable marker for potential trend change.
Traders often monitor currency pairs like GBP/ZAR or USD/JPY for Bullish Engulfing patterns following declines. Confirming with increased volume or a break above a resistance level before taking a long trade reduces risk. In volatile markets especially, spotting this pattern may save a trader from missing a significant rebound.
The Morning Star is a three-candle pattern signalling a bullish reversal. It consists of a long bearish candle, a small-bodied candle (which can be bullish or bearish) that gaps lower, and a third long bullish candle closing well into the first candle’s body. This sequence shows a clear transition from selling to buying pressure.
This pattern suggests indecision and exhaustion among sellers followed by fresh buying strength. It often appears after a prolonged downtrend, marking the start of an uptrend. The gap and the recovery shown by the third candle provide a stronger signal than single-candle patterns.
To reduce false positives, traders look for confirmation such as the fourth candle closing higher, supportive volume trends, or alignment with key support zones. In South African markets, local traders might also consider broader economic news or Rand-specific influences before acting decisively.
Bullish candlestick patterns give traders vital clues about market shifts. Reading them well can improve timing and confidence in trading decisions, especially in the fast-moving forex market.
Bearish candlestick patterns offer valuable signals for traders looking to identify potential downtrends or reversals in the forex market. Recognising these patterns can help you time entries or exits more effectively, managing risk by highlighting when sellers might be gaining control. In the fast-moving forex markets, especially in volatile pairs like USD/ZAR or EUR/ZAR, spotting a bearish pattern early can prevent losses or lock in profits.
Visual traits: Both the shooting star and hanging man share a similar shape—they have small bodies near the bottom of the candle with long upper shadows. The shooting star usually appears after an uptrend, signalling that the bulls have lost momentum. The hanging man, on the other hand, shows up at the peak of an uptrend but has a slightly different connotation due to its context. The long wick means that prices pushed higher during the session but sellers forced a close closer to the opening price, reflecting uncertainty or rejection of higher prices.
Context in downtrends: While these patterns appear after bullish moves, they hint at a possible change in sentiment. A shooting star suggests that buyers tried to push the price up but couldn’t maintain it, indicating that sellers may soon step in. The hanging man, though visually similar, warns traders that even if the trend has been strong, selling pressure is mounting. In both cases, it's the context—such as recent price action and volume—that confirms whether a genuine reversal might be on the cards.
How traders respond: Once these patterns emerge, traders often wait for confirmation before acting. For example, a lower close following a shooting star strengthens the bearish signal. Many traders place stop-loss orders just above the candle’s high to limit downside risks. In practice, you might use this signal in combination with support and resistance levels or momentum indicators like RSI to gauge whether to exit a long position or consider short positions.
Pattern description: The bearish engulfing pattern consists of two candles where the second candle completely ‘engulfs’ the first one in body size and closes lower. This shape means the bears overwhelmed the bulls decisively during that period. In forex terms, it often indicates a shift in market sentiment from buyers to sellers, especially if this appears near a resistance area or a prior uptrend.
Role in signalling reversals: This pattern serves as a clear alert that bears are gaining strength. While not foolproof, a bearish engulfing formation after a sustained uptrend can mark the start of a downward move. When confirmed by higher volume or other indicators, it can be a solid reason to prepare for possible selling pressure. Traders often view this as a cue to tighten stops or initiate short positions.
Examples in real trades: Imagine trading the USD/ZAR pair after a recent rally; a bearish engulfing candle shows up near 18.50. The selling pressure is clear, and the next few candles confirm a drop to 17.90. In such a scenario, traders who reacted to the bearish engulfing could have avoided losses or profited on the short side. Using realistic entry points and stop losses aligned to the candle’s high encapsulates disciplined risk management.
Constituent candles: The evening star pattern consists of three candles—a large bullish candle, a small indecisive candle (often a doji or small-bodied), then a large bearish candle. This sequence shows hesitation after an uptrend, followed by a strong bearish move that confirms sellers’ takeover.
Bearish reversal signs: It’s a classic indication that the bulls are tiring. The second candle highlights market indecision, where neither buyers nor sellers have control. The third bearish candle shows that sellers have overcome, signalling a likely reversal. In forex, this pattern is effective near resistance levels or when tied to other indicators suggesting weakening bullish momentum.
Best practices for confirmation: Traders often look for the next candle to close lower after the evening star to confirm the reversal. Volume spikes or declining RSI can reinforce the signal. Waiting for confirmation reduces the risk of acting on false signals, which is common with forex’s sometimes erratic price action. Setting a stop loss above the high of the evening star cluster helps manage risk.
Recognising common bearish candlestick patterns like shooting stars, bearish engulfing, and evening stars sharpens your ability to anticipate reversals and protect your forex trades. Always combine these signals with other tools and context calls to trade with confidence and discipline.
Understanding candlestick patterns is just the beginning in forex trading. Their true power lies in interpreting them properly and knowing how to use them alongside other tools. Combining candlestick signals with other indicators and sound risk management can improve your trading decisions and help avoid costly mistakes. This is especially relevant in the forex market, where quick changes and false signals are common.
Moving averages smooth out price data to highlight trends over time, which can confirm signals from candlestick patterns. For instance, spotting a bullish engulfing pattern near the 50-day moving average could suggest a decent entry point if the average indicates upward momentum. The Relative Strength Index (RSI) adds another layer by indicating overbought or oversold conditions. So, if a hammer pattern forms while RSI is below 30, it may signal a potential reversal from an oversold level.
Candlestick patterns become far more reliable when they appear at key support or resistance areas. Say a shooting star shows up near a resistance level drawn from previous highs; this reinforces the likelihood of a reversal. Conversely, a morning star pattern at a confirmed support zone often points to a bounce higher. These levels act like psychological barriers that traders watch closely, so combining them with patterns gives clearer entry or exit signals.
Volume tells you how strong a move is behind the pattern. A bullish engulfing candle accompanied by high trading volume shows genuine buying interest, increasing confidence in the reversal. On the other hand, patterns forming on low volume might be less trustworthy. Especially in volatile markets like forex, volume spikes help validate the signals candlestick patterns provide.
No strategy is complete without controlling risk. Placing stop-loss orders just beyond the opposite end of a candlestick pattern offers a clear exit if the market moves against you. For example, after entering a trade on a bullish engulfing confirmation, a stop-loss below the pattern’s low limits potential losses. This helps protect your capital and manage emotions during unpredictable moves.
Knowing how much to trade is as important as when to trade. Position sizing based on your risk tolerance and the distance to your stop-loss can reduce large drawdowns. For example, if you risk 1% of your account on a trade, you adjust the number of lots so that your stop-loss corresponds to that risk, even when the candle’s size varies.
Candlestick patterns sometimes mislead, especially in choppy or sideways markets. Avoid taking signals in isolation and wait for confirmation such as a follow-through candle or alignment with other indicators. Patience and discipline prevent you from chasing false moves and burning through your funds.
South African forex traders must navigate issues like frequent loadshedding and occasional internet disruptions. Scheduling trades around power availability and using backup power solutions can help. Also, local economic events, such as SARB statements or rand fluctuations, can heavily influence forex pairs involving ZAR, so keep updated on those.
Choosing the right broker is vital. Look for ones regulated by the FSCA with competitive spreads, especially on USD/ZAR pairs. Platforms should be mobile-friendly given data constraints many South Africans face. Familiarity with platforms like MetaTrader 4 or 5, which are widely used locally, can enhance your execution speed and charting.
Data costs remain high in South Africa, so limiting active chart monitoring can lower expenses. Use alerts to get notified of significant price moves rather than watching screens all day. Additionally, having a reliable mobile data provider like Vodacom or MTN with good coverage around your area is critical—poor connectivity can mean missed trades or delayed reactions.
By combining candlestick analysis with other indicators, managing your risk wisely, and tailoring your approach to South African conditions, you’ll be much better equipped to navigate the forex markets confidently and efficiently.
📈 Learn to spot key forex trading patterns that reveal price moves, avoid common traps, and factor in market psychology for smarter decisions in volatile forex markets.

🔍 Learn to spot hammer candlestick patterns in trading, understand their variations, confirm signals, and apply practical tips for market reversal predictions.

📈 Learn to spot bullish candlestick patterns that signal buyer strength and possible reversals, helping you make sharper trading calls across markets in South Africa and beyond.

🌍 Explore forex trading competitions where South African traders can sharpen skills, compete for R prizes, and navigate real-market challenges confidently.
Based on 6 reviews