

Choosing Good Swing Trading Stocks in South Africa
📈 Discover how to pick top swing trading stocks in South Africa with key strategies, timing tips, risk management, and analysis tools for steady gains.
Edited By
Grace Mitchell
Swing trading relies heavily on pinpointing entry and exit points that maximise gains over a short to medium period—usually a few days to a few weeks. Unlike long-term investing or day trading, this strategy demands a careful balance of timing and market analysis, where the right indicators become your eyes and ears.
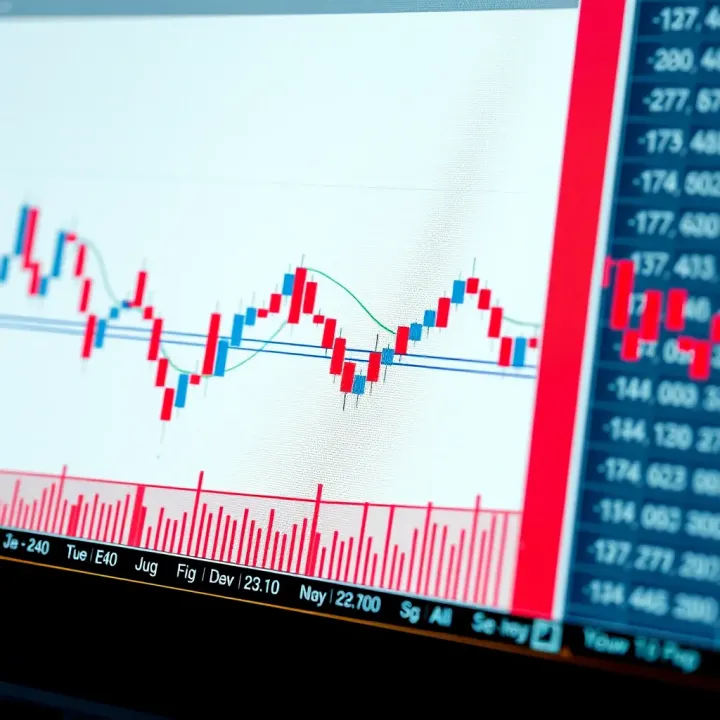
When choosing the best indicator for swing trading, it's essential to understand how these tools function and how they fit with your trading style. Some indicators excel at spotting trend reversals, others shine in confirming momentum, and a few are better at signalling overbought or oversold conditions. For example, the Relative Strength Index (RSI) helps identify when a stock may be ripe for a bounce or ripe for a drop, while moving averages smooth out price data to reveal general trends.
No single indicator is foolproof—successful swing traders typically combine signals to reduce false alarms and confirm setups.
Consider the following when selecting your swing trading indicators:
Purpose: What aspect of price movement do you want to gauge? Trend, momentum, volatility, or volume?
Timeframe: Indicators respond differently depending on your trading horizon. Shorter moving averages respond quicker but can be noisy; longer ones are smoother but lag.
Market Conditions: Trending markets often suit trend-following tools like Moving Average Convergence Divergence (MACD), while sideways markets benefit from oscillators like Stochastic.
Simplicity vs Complexity: Avoid clutter. A simple combination like RSI plus a 20-day moving average often outperforms a complex mash-up of too many indicators.
It's worth testing indicators on historical charts from local markets or global stocks you follow. Use demo accounts or paper trading to see how signals would have played out under realistic conditions.
In South African markets, with their occasional bouts of volatility linked to factors like loadshedding or political events, indicators that adjust to sudden changes can be valuable. For instance, the Average True Range (ATR) measures volatility to help set stop-loss levels that respect local market quirks.
Choosing your swing trading indicator suite isn't about picking the flashiest tool. It’s about finding what consistently reveals practical, actionable insights for your trading approach. Next, we explore the key indicators worth considering and how to combine them effectively.
Swing trading focuses on profiting from short- to medium-term price moves, holding positions usually over several days to a few weeks. Getting a grip on this style is essential for picking the right indicators because it presents a balance between day trading’s speed and long-term investing’s patience. Swing traders want tools that reliably highlight entry and exit points without drowning them in the noise typical of intraday charts.
Swing trading involves capturing price swings within a trend or sideways market. Unlike day trading, it doesn’t demand constant screen watching but requires timely decisions to catch intermediate price moves. For example, a trader spotting a bullish reversal in a blue-chip stock like Sasol might hold for a week to benefit from the rally before taking profit. The key is identifying momentum shifts and trend changes early enough to enter and exit with a solid risk-reward ratio.
Swing trading thrives where markets have clear cycles but lack the extreme volatility of intraday sessions, making it practical for professionals juggling other responsibilities or analysts who work with broader market views.
Indicators suited for swing trading need to filter out minor price fluctuations while signalling meaningful trend changes. They should provide clear signals over daily or 4-hour charts, not just on a minute-by-minute basis. For instance, a simple moving average (SMA) crossover on daily charts can signal a trend shift without triggering trades from every minor dip.
Practical features include:
Trend Sensitivity: The indicator should detect emerging trends without lagging too much, helping traders catch moves early.
Momentum Confirmation: Combining trend with momentum indicators can confirm the strength behind price moves, reducing false signals.
Volatility Assessment: Understanding when the market is calm or volatile helps adjust trade size and stop-loss levels.
Adaptability: Markets evolve, so indicators with adjustable settings allow traders to fine-tune based on asset type and prevailing conditions.
Good swing trading indicators don’t just signal when a move is happening; they help place trades where the odds are stacked in your favour and stay out when uncertainty is high.
Understanding these elements offers a solid foundation when choosing or combining indicators. For example, integrating RSI with moving averages can help identify both trend direction and overbought/oversold conditions, which is particularly useful in swing trading contexts.
In short, knowing what swing trading demands from your tools means you’re less likely to chase every twitch and more likely to focus on meaningful signals that match your trading horizon and risk appetite.
Swing trading relies heavily on indicators that help predict short- to medium-term price moves. Understanding how these tools work lets you pick the right ones for your strategy and avoid getting bogged down by conflicting signals. Popular technical indicators not only highlight potential entry and exit points but also measure momentum, trend strength, and volatility — all crucial for navigating swings over days or weeks.
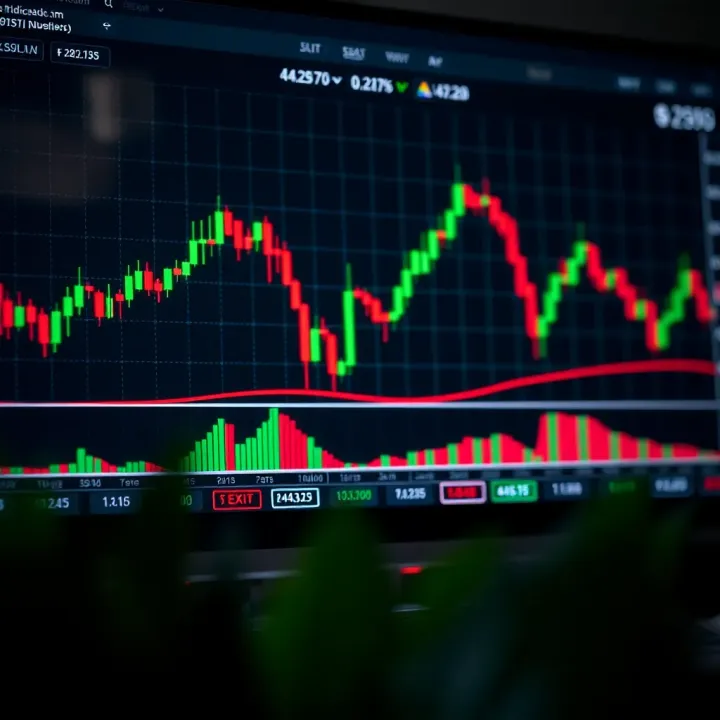
Simple Moving Average (SMA) averages prices over a set period, smoothing out daily ups and downs to reveal the underlying trend. For example, a 20-day SMA shows the average closing price of the last 20 days and shifts forward as new data arrives. Traders often watch for crossovers—when a short-term SMA crosses above a longer-term one—to spot momentum shifts. However, because SMA treats each day equally, it can lag behind sudden market changes, potentially causing you to miss faster moves.
Exponential Moving Average (EMA) gives more weight to recent prices, making it more responsive to changes. This sensitivity helps capture turning points earlier than the SMA, which many swing traders find valuable. For instance, in volatile markets like forex or shares prone to sudden jolts, a 12-day EMA reacting quickly might allow you to enter or exit before the crowd catches on. Yet, quicker reactions also mean more false alarms, so it's wise to pair EMA with other signals to filter noise.
RSI measures the speed and change of price movements to identify overbought or oversold conditions. Values above 70 typically signal a potential pullback, while those below 30 suggest a rebound might be near. For swing traders, RSI can flag when a price has stretched too far too fast, helping to time exits or entries better. Unlike moving averages that track trends, RSI focuses on momentum, providing a complementary angle.
MACD combines two EMAs to reveal momentum changes and trend direction. The difference between the fast (usually 12-day) and slow (26-day) EMAs oscillates around a zero line. When the MACD line crosses above its signal line, it often points to bullish momentum building. Conversely, crossing below can warn of weakening trend. MACD’s histogram visually displays these shifts, making it easier to spot divergence where price and momentum disagree—a classic swing trading alert.
Bollinger Bands stretch and contract around a moving average based on price volatility, represented by standard deviations. When bands tighten, it signals low volatility and often precedes a strong price move. Wider bands indicate high volatility, often after big price swings. Swing traders look for breakouts outside these bands as possible trend starters but also watch for price returning inside to signal potential exhaustion. This tool helps gauge whether the market mood is calm or jittery, which is vital before making trade decisions.
Each indicator offers a different lens. Knowing their strengths and limits helps you make smarter, quicker calls in the fluctuating world of swing trading.
Combining indicators can provide a clearer picture when swing trading, helping to confirm signals and reduce false alarms. No single indicator tells the whole story; pairing tools that measure different aspects of the market improves the quality of decisions. For example, momentum indicators reveal the strength behind price moves, while trend indicators show overall direction. Using them together prevents chasing weak or short-lived moves.
Momentum indicators like the Relative Strength Index (RSI) measure the speed and magnitude of price changes, signalling when an asset is overbought or oversold. Trend indicators, such as moving averages, smooth out price fluctuations to highlight the prevailing direction. When combined, they offer a dual perspective: the trend shows where price is heading, and momentum confirms if there’s enough force behind it. For instance, if the price is above a rising moving average but the RSI is falling, that could be a warning of weakening momentum despite the uptrend.
A key challenge in swing trading lies in distinguishing meaningful signals from market noise—random price swings that can cause confusion. Combining indicators helps filter out this noise. Trend indicators reduce the impact of minor fluctuations by smoothing prices, while oscillators act as gatekeepers for timing entries and exits. This balance lets traders avoid overreacting to every twitch in price and instead focus on moves with potential.
Using multiple indicators wisely helps swing traders fine-tune when to enter and exit trades while minimising false signals caused by unpredictable price jumps.
Pairing RSI with moving averages creates a solid combo for swing trading. Moving averages define the overall trend—say a 20-day exponential moving average (EMA) signals an uptrend when price stays above it. RSI then helps spot optimal entry points within this context. When RSI dips below the oversold threshold (usually 30) during an uptrend, it may indicate a pullback is ending and the price could resume its climb. Conversely, if RSI hits the overbought zone (above 70) while price is near the moving average resistance, a reversal or pause might be imminent.
This blend of trend confirmation with momentum-based timing reduces guesswork. For example, a Gauteng-based trader might see the local stock JSE Top 40’s 20-day EMA rising steadily and wait for the RSI to pull back below 30 before buying — capturing dips rather than chasing highs.
The Moving Average Convergence Divergence (MACD) indicator captures shifts in momentum and trend strength through the convergence or divergence of short- and long-term moving averages. Paired with Bollinger Bands, which measure volatility through dynamic upper and lower bands around a moving average, traders get a multi-dimensional view.
When price approaches the lower Bollinger Band during a downtrend and the MACD histogram shows a bullish crossover, it might be a good entry signal, as volatility is increasing but momentum is tipping upward. Similarly, a price hitting the upper band in an uptrend combined with a bearish MACD crossover warns of potential reversal or consolidation.
This combination suits swing traders looking to capture moves when volatility expands or contracts in tune with momentum shifts. A Cape Town-based trader might spot a local resource stock squeezing between bands and use MACD crossovers to time entries during emerging breakouts.
Combining indicators requires practice and adjustment based on asset behaviour and timeframes. But when used thoughtfully, the blend of momentum and trend signals can enhance swing trading strategies, increasing confidence and managing risk better.
Tailoring your indicators to match your swing trading style is not just helpful—it’s essential. Every trader has unique preferences and risk tolerance, and no one-size-fits-all indicator can cover all scenarios. Customising your tools according to your approach helps you spot opportunities more clearly and manage risks without overcomplicating the process.
Trade timeframe greatly influences which indicators work best. For example, a trader focusing on two- to five-day swings might rely on shorter moving averages like the 10- or 20-day EMA for faster signals. Conversely, someone holding positions longer might prefer 50- or 100-day SMAs to smooth out noise.
Asset classes matter too. Swing trading forex pairs demands attention to different volatility levels and market hours compared to shares on the JSE. For instance, South African miners often react to commodity price shifts, where volatility plays a bigger role. Indicators like Bollinger Bands might be better suited here to measure volatility squeezing or expanding.
Markets don’t sit still; they shift from trending to ranging phases, and your indicators should adapt accordingly. During trending periods, a trader might decrease the RSI period from 14 to 7 to get signals sooner, while in sideways markets the standard 14 keeps overbought or oversold warnings more reliable.
For example, if you’re trading Naspers shares during a strong upward trend, tweaking your MACD’s signal line length or EMA periods can prevent premature sell signals. Similarly, during volatile times like pre-election months or global crises, widening Bollinger Bands settings can help prevent whipsaw trades.
Customising indicator settings to reflect current market behaviour can be the difference between missing a trade and catching a timely opportunity.
It’s tempting to throw every indicator into your chart, hoping to cover all bases. But too many tools cause confusion and contradicting signals. Stick to two or three complementary indicators that address trend, momentum, and volatility.
Keep your chart clean and focused. For instance, combining a moving average for trend direction, RSI for momentum, and Bollinger Bands for volatility generally covers the essentials. Avoid layering too many oscillators—having more than one momentum indicator often just repeats the same signals.
Also, regularly review and simplify your setup. Ask yourself if each indicator adds value or just clutter. Remember, usability beats complexity. A straightforward setup helps you react quickly during fast moves, especially when trading volatile South African shares or currency pairs.
In short, tailor your indicators with care: match them to how and what you trade, adjust settings to fit market moods, and keep your toolbox lean and effective. This approach builds confidence and sharpens decision-making in swing trading.
When using indicators for swing trading, getting caught in common pitfalls can seriously undermine your results. These tools provide helpful signals, but they aren't crystal balls. Understanding where traders often slip can save you from costly errors and wasted time.
Relying on a single indicator puts you at risk of missing the full picture. For example, depending only on the Relative Strength Index (RSI) might lead you to buy during an overbought rally, ignoring underlying trend weakness. A better approach is to combine indicators that measure different aspects—like trend strength alongside momentum. This balance helps filter out false signals and gives more confidence in your trades.
Indicators can't replace good judgement of market conditions. A common mistake is following indicator signals blindly without considering price action or broader market context. For instance, an RSI showing oversold conditions during a strong downtrend is likely a signal to wait rather than jump in. Watching support or resistance levels and candlestick patterns alongside indicators helps you confirm potential entries and exits. Remember, indicators reflect past prices so blending them with real-time price action grounds your decision-making.
Some indicators generate frequent signals that tempt traders into overtrading, leading to higher costs and emotional burnout. Bollinger Bands squeeze is one such example, alerting many potential breakouts but with a high false positive rate. Setting clear entry rules and avoiding impulsive trades based on every alert preserves capital and focus. It's often better to wait for confirmation or combine signals rather than act on every twitch.
Successful swing trading depends as much on managing signals wisely as on choosing the right indicators. Avoiding these pitfalls can help you stay disciplined and make smarter, well-timed trades.
By steering clear of these traps—such as overdependence on one indicator, ignoring what the overall market tells you, or acting on too many signals—you’ll improve your trading outcomes and confidence. Practical, well-rounded use of indicators coupled with market awareness remains the best recipe for swing trading success.
📈 Discover how to pick top swing trading stocks in South Africa with key strategies, timing tips, risk management, and analysis tools for steady gains.

📉 Forex trading can be risky with rapid market changes, complex strategies, and losses. Understand these challenges to make smart trading moves in South Africa and beyond.

Explore the essentials of forex trading📈, from market basics to key strategies, designed to boost your confidence in currency trading.

📚 Explore top forex trading books to master strategies, market analysis, risk management & trading psychology for South African traders aiming to improve and succeed.
Based on 10 reviews