

Bullish Candlestick Patterns for Smarter Trading
📈 Learn to spot bullish candlestick patterns that signal buyer strength and possible reversals, helping you make sharper trading calls across markets in South Africa and beyond.
Edited By
James Thornton
Candlestick patterns offer traders valuable insights into market sentiment by visually representing price movements over specific periods. These patterns, formed by the open, close, high, and low prices, help spot potential reversals or continuations in price trends. For traders in South Africa and elsewhere, understanding these signals can improve your timing in entering or exiting trades.
Unlike simple line charts, candlestick charts provide a more detailed, easily interpretable view of price action. For example, a long green (or white) candle points to strong buying pressure, while a long red (or black) candle signals selling dominance. By recognising recurring formations, you can anticipate what might happen next rather than reacting blindly.

Mastery of candlestick patterns isn’t about memorising every single formation; it’s about grasping the key patterns and context to make smarter decisions in the heat of the market.
Some of the most useful single-candle patterns include:
Hammer: suggests a possible bullish reversal after a downtrend, identified by a small body near the top and a long lower wick.
Shooting Star: indicates a potential bearish reversal following an uptrend, seen as a small body near the bottom with a long upper wick.
Multi-candle patterns add further depth:
Engulfing Pattern: where a candle completely covers the previous candle’s body, signalling a shift in momentum.
Morning Star / Evening Star: three-candle sequences that highlight strong reversal potential.
Learning how to read these charts effectively involves more than just pattern recognition. You need to consider the bigger picture: overall trend, support and resistance zones, and volume context. Combining patterns with other tools, like moving averages or RSI, can increase accuracy.
PDF cheat sheets provide a handy reference you can quickly consult during trading sessions. These guides usually feature clear illustrations of common patterns with brief explanations, helping reinforce your memory and sharpen pattern spotting.
This section lays the foundation for exploring candlestick patterns practically, ensuring you gain clear, actionable insight rather than just theoretical knowledge. Next, we’ll explore specific patterns in detail along with tips on reading charts like a pro.
Candlestick charts are foundational tools for traders and investors aiming to assess market behaviour quickly and accurately. Unlike simple line charts, candlestick charts offer detailed insights by displaying price movements in discrete time intervals — be it minutes, hours, or days. Understanding how to read and interpret these charts is vital for making informed decisions, whether you’re trading equities on the JSE or forex pairs involving the rand.
A single candlestick consists of four key data points: the open, close, high, and low prices within a set timeframe. The body of the candlestick shows the price range between the open and close, while thin lines called shadows or wicks extend above and below the body, representing the highest and lowest prices reached.
Take, for instance, a daily candlestick where the opening price on a Johannesburg Stock Exchange stock is R100, the closing is R105, the highest point R108, and the lowest R98. The body will span from R100 to R105, indicating upward movement as the close is higher than the open. The shadows show intra-day price fluctuations.
The relationship between open and close prices signals market sentiment. A close higher than the open often points to buying pressure, whereas a lower close hints at selling pressure. Additionally, long shadows might indicate indecision or volatility; if the upper shadow is lengthy, buyers pushed prices high but lost control before the close.
Understanding these components helps traders recognise price action nuances. For example, a candlestick with a small body but long shadows could reflect a battle between bulls and bears. In South African markets, where economic news and local events can trigger sharp moves, quick reading of such cues aids effective timing.
Candlestick patterns distil complex trading activity into visual forms, making it easier to gauge investor mood. Patterns like hammers or shooting stars reveal whether buyers or sellers dominated a session. This visual storytelling adds depth beyond raw numbers.
Consider the impact of loadshedding announcements on the stock market; candlestick patterns often quickly reflect traders’ sudden shifts in sentiment. Spotting these patterns can warn you of potential reversals or continuation in price trends.
Mastering candlestick patterns gives you a lens to read the market’s collective psychology rather than just prices.
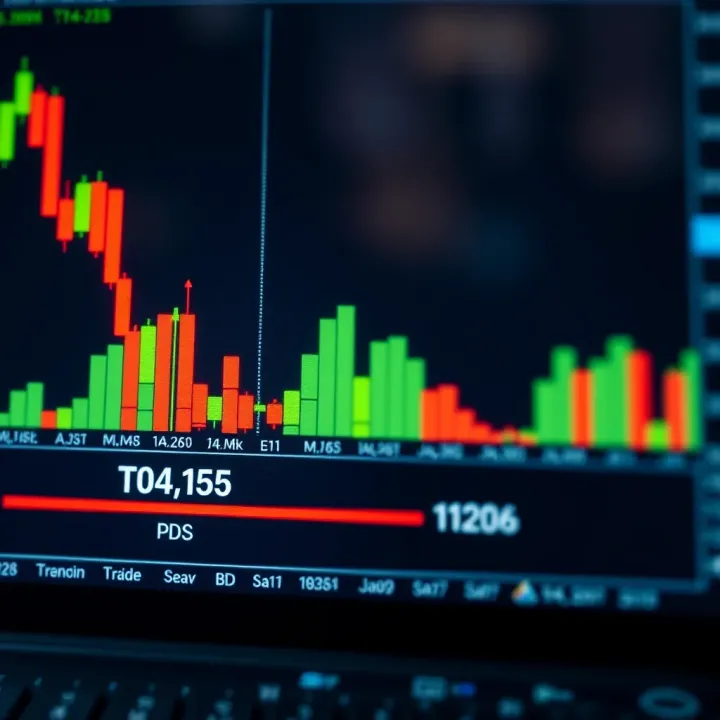
Certain patterns historically precede specific market moves. For example, a bullish engulfing pattern can signal a potential rally after a downtrend. Identifying these enables traders to anticipate price shifts and position accordingly.
Still, context matters. On the JSE, patterns in resource stocks might behave differently compared to currency pairs involving the rand, due to varied market drivers. Traders who combine candlestick readings with local economic indicators stand a better chance at forecasting movements and managing risks.
Grasping how candlestick charts work equips you with a practical tool to navigate market volatility and seize trading opportunities in the fast-changing South African financial environment.
Understanding common candlestick patterns is essential for any trader aiming to read market sentiment clearly. These patterns offer quick visual clues about potential price movements, helping you make more confident decisions whether you trade equities on the JSE or forex pairs involving the rand.
Hammer and Inverted Hammer: Both patterns signal potential bullish reversals, often after a downtrend. A hammer has a small body near the top with a long lower wick, showing that sellers pushed prices down but buyers regained control. The inverted hammer is similar but with the long wick above the body, hinting buyers trying to push prices higher. In practice, spotting a hammer on a chart for a local stock like Sasol after a price dip can signal a buying opportunity.
Morning Star: This pattern appears as a three-candle formation indicating a strong shift from bearish to bullish sentiment. The first is a long bearish candle followed by a small-bodied candle (signalling indecision), then a bullish candle closing well into the first candle’s body. It’s practical for confirming trend reversals, such as when municipal bonds start recovering after a period of weakness.
Bullish Engulfing: This involves a smaller bearish candle followed by a larger bullish candle that completely engulfs the first. It reflects a sudden change in momentum in favour of buyers. For example, if this occurs on a share like Naspers, traders might interpret it as a signal of rising demand and prepare for an upward move.
Shooting Star: This is a single candle with a small body near the day’s low and a long upper wick, showing that prices tried to rise but sellers forced them down. It usually suggests a bearish reversal after an uptrend. South African traders might watch for this on resource shares after a run-up, cautioning that sellers might soon step in.
Evening Star: The inverse of the Morning Star, this three-candle pattern signals a shift from bullish to bearish. It starts with a long bullish candle, followed by a small indecisive candle, then a strong bearish candle closing into the first candle's body. Such a pattern on a currency pair like ZAR/USD could hint at weakening rand strength.
Bearish Engulfing: This pattern features a small bullish candle followed by a larger bearish candle that fully covers the previous one. It points to sellers gaining control and potential price declines. Spotting this on a commodity like platinum might suggest to miners and investors to brace for downward pressure.
Doji Variants: Doji candles have nearly equal open and close prices, reflecting indecision in the market. Their significance depends on context; they can precede reversals or mark periods of consolidation. For instance, a Doji after strong moves in Telkom's share price may signal hesitation among traders.
Spinning Tops: These candles show small bodies with wicks on both ends, indicating balance between buyers and sellers but with some uncertainty. They often suggest a pause or potential reversal if confirmed by following candles. Traders spotting these might wait for clearer signals before entering positions.
Three White Soldiers: Comprising three consecutive long bullish candles, this pattern signals steady buyer strength and potential continuation of an uptrend. Observing this in a fast-moving sector like technology stocks listed on the JSE may encourage traders to hold or add to positions.
Knowing these patterns and their practical applications in the South African market landscape helps traders read price action more effectively and make better-informed decisions, whether for short-term trades or longer-term investments.
Candlestick pattern PDFs serve as handy tools for traders looking to improve their chart reading skills without juggling multiple web pages or books during market action. These resources condense key pattern visuals and explanations into a portable, easy-to-navigate format. When used well, they can sharpen your ability to spot meaningful price signals quickly — a must for traders balancing fast-paced decisions.
Having a PDF on hand means you’re not tied to constant internet access, which is crucial in areas with unreliable connectivity or during load-shedding periods common in South Africa. You can study market patterns during downtime or on the go, without the distraction of notifications or ads popping up. For example, prepping in the early hours before the JSE opens can be far more productive with a saved PDF reference instead of scrolling through multiple websites.
PDFs usually present patterns with uniform visuals and explanations, which helps build recognition faster compared to flicking through various sources with different styles. Repetition of the same clear images, like the Hammer or Shooting Star, reinforces memory retention. Plus, a standardised layout helps reduce confusion — you know exactly where to find the pattern illustrations and key points when you need them.
Rather than guessing what pattern is forming in real time, you can use your PDF chart if you need to double-check at the desktop or on a tablet. This immediate cross-reference boosts confidence before placing trades. For instance, when watching volatile forex pairs involving ZAR, spotting an Evening Star from your PDF might signal a sell-off ahead. Practicing this regularly turns recognition into second nature.
Knowing patterns in advance allows you to plan possible moves instead of reacting in panic. When you review your PDF before trading sessions, you set up mental alerts for patterns that could shape your decisions. Say you see several Morning Star formations appearing on the weekly JSE charts – it could be a cue to prepare for bullish momentum and adjust your portfolio accordingly. This preparation is especially useful during local economic announcements that heighten market swings.
Keeping a reliable, easy-to-access PDF reference simplifies pattern recognition and keeps you ready for smart, timely trading calls in ever-changing markets.
Candlestick patterns don't work in isolation; their interpretation depends heavily on the context, especially within South African markets. These markets have unique features and external factors that influence price movements in ways different from global markets. Understanding local conditions helps traders avoid misreading signals and enhances their ability to act confidently.
South Africa’s economic environment and infrastructure challenges directly affect market behaviour. Loadshedding from Eskom, for instance, can cause sudden and irregular trading volumes as market participants react to disruptions. After a load-shedding event, you might see unusual volatility in equities or commodities linked to power supply, such as mining stocks, which often experience sharp price movements not explained purely by fundamentals.
Moreover, economic news releases from Treasury, SARB, or major corporates impact markets noticeably. These announcements can magnify the effect of common candlestick formations by triggering sharper reversals or momentum continuation. A bullish engulfing pattern on the JSE, for example, during a positive GDP or jobs report day, may offer stronger confirmation than under quiet market conditions.
Seasonal variations also play a part. Trading activity in December and January tends to slow down as many traders are on holiday or focusing on the festive season. This lower liquidity can produce misleading candle wicks, false breakouts, or lacklustre patterns. Conversely, the start of a new tax year or matric results season often picks up market momentum, introducing clearer pattern signals.
Equities on the JSE often reflect both local and international sentiments. Sectors like mining, retail, and financials respond to specific catalysts such as commodity price changes or domestic consumer spending data. Candlestick patterns here might signal more enduring trends because institutional investors usually dominate these stocks, causing patterns such as the morning star or shooting star to carry weight over multiple sessions.
With forex pairs involving the South African Rand (ZAR), patterns must be read with an eye on external forces like global risk appetite or USD behaviour. The ZAR/USD pair, for example, reacts fast to geopolitical tensions, SARB policy changes, or trade balances. A doji or spinning top might indicate indecision before a breakout influenced by factors beyond domestic supply and demand.
Commodity contracts relevant to the region, such as gold, platinum, or maize futures, require adapting pattern reading to global commodity cycles and local supply disruptions. A bearish engulfing pattern on platinum futures might suggest a short-term price pullback, but one must consider the mining strikes or export restrictions locally, which can significantly delay or override standard pattern expectations.
Remember, no one pattern is foolproof. Pay attention to how local events and asset-specific factors shape the market's story alongside your candlestick chart.
Tailoring your approach to these realities sharpens analysis and decision-making when using candlestick patterns to trade smarter within South Africa’s vibrant and sometimes unpredictable markets.
For traders relying on candlestick patterns to guide decisions, having access to accurate and trustworthy PDF resources is vital. These pattern PDFs act as quick reference guides, helping you recognise key formations without confusion. Especially in a fast-paced market—where split seconds count—being able to pull up consistent visual examples ensures you’re not second-guessing signals or missing crucial cues.
Financial education websites often provide reliable and well-researched candlestick pattern PDFs. These platforms—run by experienced market analysts or financial educators—offer downloadable guides designed for learners at various skill levels. For instance, sites like Investopedia or local South African finance education platforms may have materials adapted to our markets or include commentary relevant to conditions such as loadshedding effects or JSE trading peculiarities. The benefit here lies in trustworthiness and quality control; you're less likely to encounter conflicting or inaccurate interpretations.
On the other hand, brokerage platforms with educational materials are practical sources for candlestick PDFs as well. Many brokers approved by the Financial Sector Conduct Authority (FSCA), such as Standard Bank's stockbroker division or EasyEquities, provide free access to pattern charts to registered users as part of their trading tools. These often come bundled with educational content tailored to the instruments they offer, like equities or forex involving ZAR pairs. Using these resources helps bridge theory with the platform interface you’re trading on, improving pattern recognition within your actual trading environment.
Organising patterns by category enhances the learning process and quickens pattern recall. You can group patterns into bullish, bearish, and neutral categories or segment them according to their timeframe relevance—daily, weekly, or intraday. This method simplifies things when you study or during live trading, as you’ll immediately know what type of signal you’re looking at and its likely market implication. Digital folders or even a physical binder sorted this way keep your resources tidy and easy to navigate under pressure.
Adding personal notes and observations to your PDFs transforms static charts into an active learning journal. After spotting a pattern in the market, jot down the outcome or nuances noticed, such as false signals or how local market events affected pattern reliability. Over time, these notes build valuable context tailored to your trading style and the unique behaviour of South African assets. Plus, reviewing your own insights reinforces memory better than generic examples alone.
Reliable and customised reference tools not only boost confidence but also sharpen your judgement in identifying meaningful candlestick patterns amidst market noise.
Having dependable downloads and a personalised system puts you in a stronger position to respond quickly and decisively, rather than scrambling for information mid-trade.
📈 Learn to spot bullish candlestick patterns that signal buyer strength and possible reversals, helping you make sharper trading calls across markets in South Africa and beyond.

📈 Learn to spot bullish candlestick patterns on charts, understand market trends, and use practical tips with handy PDF summaries for smarter trading decisions.

📈 Learn how key candlestick patterns reveal market trends in forex trading. Master bullish & bearish signals plus tips for South African traders to boost your strategy.

📈 Learn how to spot key chart patterns and apply them in trading. Discover practical tips and find PDF books to sharpen your skills, whether you're a newbie or seasoned trader.
Based on 9 reviews