
Guide to Bullish Candlestick Patterns in Trading
📈 Learn to spot bullish candlestick patterns on charts, understand market trends, and use practical tips with handy PDF summaries for smarter trading decisions.
Edited By
Sophia Clarke
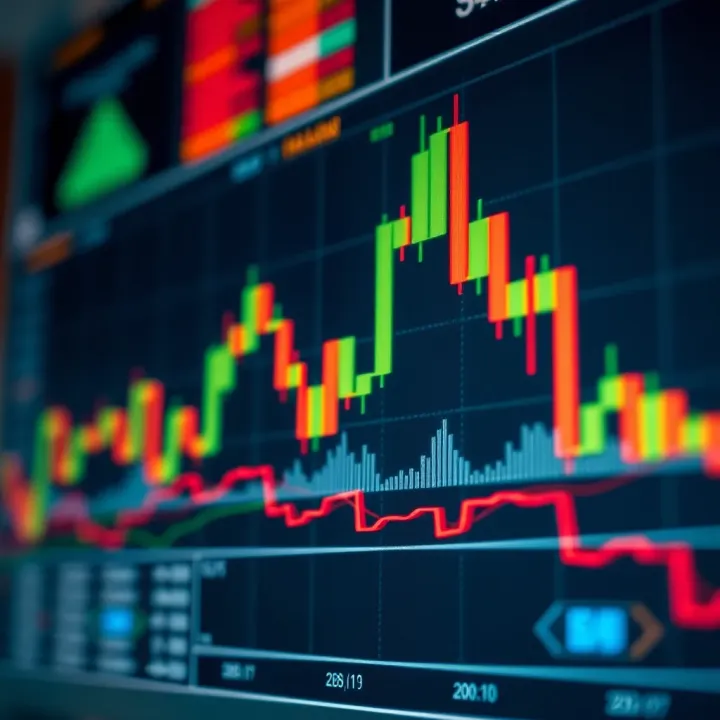
Candlestick patterns have become a staple for traders and investors eager to decode market moves quickly and effectively. Originating from Japanese rice traders centuries ago, these patterns offer a visual representation of price movements that reveal market sentiment in a single glance.
At their core, candlestick charts display four key prices: the opening, closing, highest, and lowest within a given trading period. The shape and colour of each candle tell a story—whether buyers controlled the session or sellers pushed prices down.
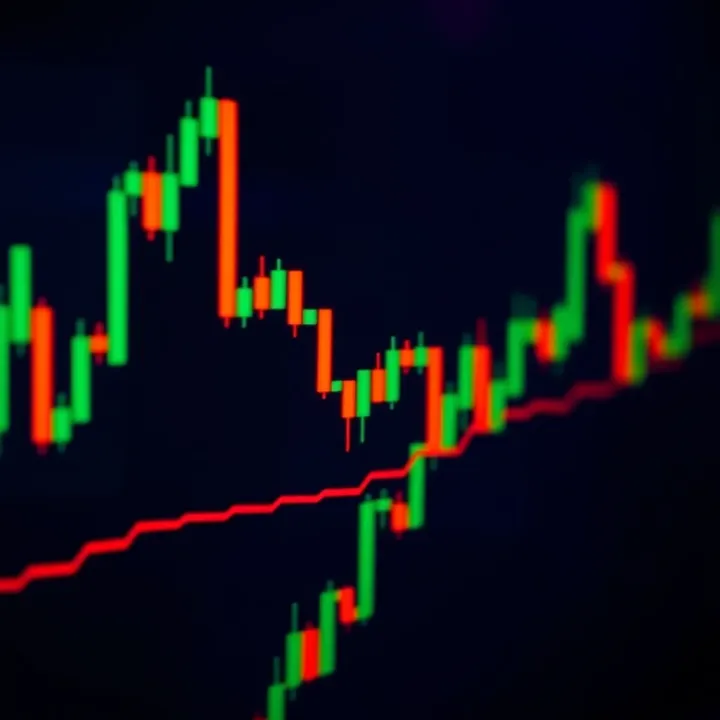
For South African traders, understanding these patterns can sharpen decision-making amid volatile local markets, affected by factors like fluctuating commodity prices and Eskom’s loadshedding schedules. Candlestick analysis works well alongside other technical tools familiar to local analysts, such as moving averages or RSI (Relative Strength Index).
Here’s why candlestick patterns matter:
Instant visual cues: Patterns quickly highlight shifts in momentum.
Trend signals: Formations point to potential trend continuation or reversals.
Entry and exit guidance: Help set smarter buy or sell points.
A few practical notes before we start:
Candlesticks alone don’t guarantee success but improve risk management when combined with sound strategies.
Knowing the difference between single-candle patterns (like the Hammer) and multi-candle patterns (like the Engulfing pattern) is vital.
Real examples from the JSE can solidify your grasp, as these patterns behave subtly differently depending on overall market context.
To master candlestick reading, practise spotting these formations in actual charts daily. This hands-on approach hones intuition and makes technical analysis feel less like guesswork and more like informed analysis.
In the sections ahead, we'll break down key candlestick patterns with clear examples, to equip you with tools that resonate with the South African trading landscape.
Candlestick charts provide traders and investors with a clear visual snapshot of market sentiment during a given trading period. This section lays the foundation by explaining the origins and basic features of candlestick charts, highlighting why they have become a go-to tool for analysing price movements. Understanding these basics is essential for recognising patterns that suggest potential market direction.
Candlestick charts first appeared in Japan, developed by rice traders in the 18th century to track price movements. This method offered a more intuitive way to read market behaviour than the line charts common in the West at that time. Their long-standing history reflects practical use across centuries, proving their effectiveness in capturing price nuances. Even today, South African traders use this age-old technique as part of their technical analysis toolkit.
Each candlestick represents price action within a specific time frame—this could be one minute, a day, or longer. It consists of a body and shadows (also called wicks). The body shows the opening and closing prices, while the shadows mark the highest and lowest prices reached. For example, if a JSE-listed stock opens at R100 and closes at R110 with a high of R115 and a low of R98 within a day, the candlestick clearly shows this range. Each element helps you quickly assess whether bulls or bears controlled the session.
Candlestick charts are popular because they convey complex price data in an easy-to-grasp picture. Unlike simple line charts that just show closing prices, candlesticks display the full trading range and direction, making it quicker to spot potential reversals or continuations. For instance, a hammer candlestick—a small body with a long lower shadow—might indicate a price floor forming after a decline, signalling buyers stepping in.
Compared to bar charts or line charts, candlestick charts combine detailed information with visual clarity. Bar charts show similar data but can look cluttered with many bars in a short span. Line charts are simpler but miss intraday highs and lows. In markets like the JSE, where sudden shifts and volatility can occur, candlesticks offer a balanced view, helping you make timely, informed decisions without being overwhelmed by noise.
A solid grasp of candlestick charts sets you up to interpret patterns effectively, giving you an edge in timing trades and managing risk in South Africa’s dynamic markets.
Understanding individual candlesticks is fundamental for traders and investors aiming to read market sentiment quickly and accurately. Each candle provides essential information about price movement within a specific period, which helps you gauge whether bulls or bears are in control. The more familiar you become with the shape and components of a single candlestick, the better you can anticipate probable price behaviour.
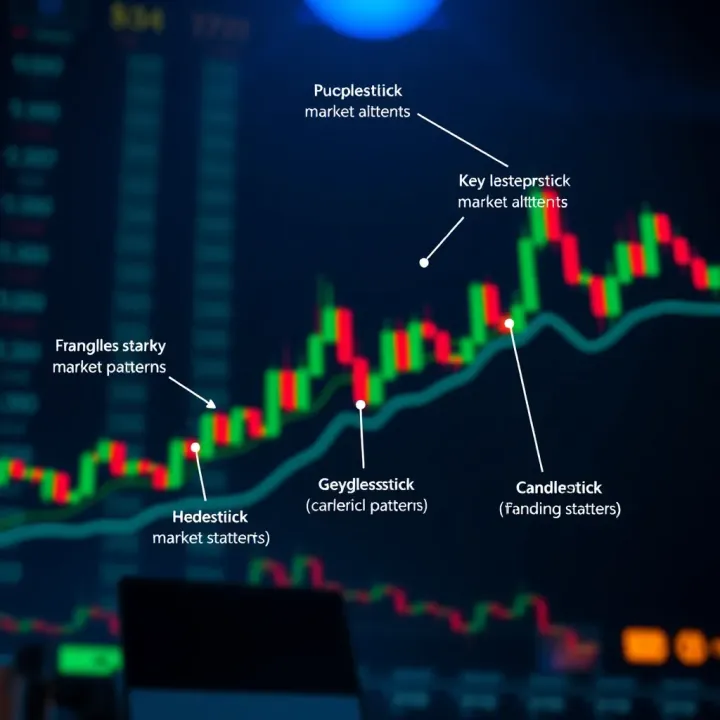
Every candlestick shows four main price points: the open, close, high, and low. The body of the candle forms between the opening and closing prices, while the shadows (or wicks) extend to the high and low extremes reached during the trading session. For example, in a Johannesburg Stock Exchange (JSE) share trade, if the open is R150 and the close is R155, the body displays that buying pressure outweighed selling during that timeframe. Meanwhile, the upper shadow can tell you how far prices pushed above the close, and the lower shadow shows how far prices dipped below the open.
Recognising these elements provides immediate insights into volatility and trader indecision. For instance, a long shadow at the top might suggest sellers pushed prices down after a strong rally, hinting at potential resistance at those levels.
A candlestick is bullish when the closing price is higher than the opening price, usually shown with a lighter or green body, indicating upward momentum. Conversely, a bearish candle closes below its opening price and is often depicted in red or darker shades, which signals selling pressure.
In practice, spotting consecutive bullish candles after a decline might suggest buyer confidence returning to the market — say, a platinum miner like Northam Platinum showing a string of bullish candles could imply a turnaround. On the other hand, a sudden bearish candle following several green ones might warn of a pullback or profit-taking.
Doji: This pattern forms when the opening and closing prices are virtually the same, creating a very small or non-existent body with shadows on either side. A doji highlights market indecision, where neither buyers nor sellers have clear control. In South Africa's often volatile markets, encountering dojis near key support or resistance levels can hint at a pending reversal or consolidation.
Hammer and Hanging Man: Both candles have a small body near the top (hammer) or bottom (hanging man) with a long lower shadow. A hammer appearing after a downtrend suggests a potential bullish reversal, as buyers managed to push prices back up despite initial selling. Conversely, a hanging man after an uptrend signals possible bearish reversal, warning traders to be cautious about further gains.
For example, if Capitec's share price forms a hammer after a dip, it might be an early signal for recovery, especially when confirmed by subsequent bullish candles.
Spinning Top: This candle has a small body with longer upper and lower shadows, reflecting uncertainty and balanced forces between buyers and sellers. Spinning tops often appear in sideways markets or before significant moves, signalling that traders are weighing their options. Spotting these in the JSE's mining or retail stocks might mean a break in either direction is on the cards.
Learning to interpret these candlestick singles helps you read the market's pulse faster, allowing for timely and better-informed trading decisions.
Combining this knowledge with broader patterns and volume data builds a more complete trading picture suited to South Africa’s unique market rhythms and challenges.
Multiple-candlestick patterns carry more weight than single candles because they show evolving market sentiment over several sessions. These formations can signal trend reversals or continuations, making them valuable tools for traders and analysts aiming to time entry and exit points better. Recognising these patterns on charts of JSE-listed stocks, for instance, can help anticipate shifts in momentum before volume or price indicators confirm the move.
Engulfing patterns occur when a smaller candle is completely overtaken by the next candle’s body, indicating a sudden shift in control between buyers and sellers. A bullish engulfing pattern, where a green candle swallows a preceding red one, suggests rising buying pressure and a possible reversal from a downtrend. Conversely, the bearish engulfing pattern points to growing selling pressure after an uptrend. In volatile South African sectors such as mining or retail, spotting engulfing patterns early can help avoid getting caught in sudden reversals.
The Morning and Evening Star are three-candle patterns signalling a potential market turn. The Morning Star typically forms at the bottom of a downtrend—the first candle is bearish, followed by a small-bodied candle indicating indecision, and finally a strong bullish candle showing buyers stepping in. The Evening Star is the reverse, appearing after an uptrend and signalling bearishness. These patterns work well in practice when confirmed with volume spikes, as they reveal a real tug-of-war between bulls and bears.
Piercing line and Dark cloud cover patterns are two-candle signals of trend reversal. The piercing line forms in a downtrend with a bullish candle opening below the previous close but closing more than halfway up the prior candle’s body, pointing to buyer strength returning. Dark cloud cover appears at an uptrend’s peak— a bearish candle opens above the previous close but closes deep into the prior candle, signalling sellers gaining control. Both patterns are faster to spot than the Morning and Evening Star but need confirmation from other indicators.
The Three White Soldiers pattern is a bullish continuation formed by three consecutive long-bodied green candles with small wicks, each closing progressively higher. It shows sustained buying interest and typically follows a consolidation phase. Traders spotting this pattern in strong sectors like financials may anticipate continued upward momentum.
Opposite to this, the Three Black Crows pattern features three long-bodied red candles closing lower each day, signalling persistent selling pressure after an up-move. This pattern warns of a likely downturn or correction and fits well in timing exits or tightening stops.
Rising and Falling Three Methods are quiet yet powerful continuation patterns signalling brief pauses before a trend resumes. The Rising Three Methods involves a strong green candle followed by several small-bodied red candles staying within the first candle’s range, then a final bullish candle breaking higher. The Falling Three Methods is the bearish counterpart. These patterns are handy for traders who prefer clearer signals before jumping back into trends.
Understanding these common multiple-candlestick patterns can provide practical insights into market psychology, helping traders interpret price action beyond isolated candles. In South African markets, combining these patterns with local conditions and volume analysis tightens decision-making and can improve trade timing significantly.
Applying candlestick patterns in trading is more than simply spotting shapes on a chart; it involves interpreting these signals alongside other factors to make solid trading decisions. Candlestick patterns can indicate potential price movements, but relying on them alone might lead to false signals. Combining them with volume and trend indicators helps traders confirm whether a reversal or continuation is genuine.
Moving averages smooth out price data to reveal underlying trends, helping traders avoid reacting to short-term market noise. When a candlestick pattern forms near a significant moving average—like the 50-day or 200-day simple moving average (SMA)—it adds weight to the signal. For example, if a bullish engulfing pattern occurs right above the 50-day SMA for a JSE stock like Sasol, it suggests stronger buying momentum as the price respects this support level.
Traders often watch for crossovers, where a short-term moving average crosses a longer-term one. If a candlestick reversal pattern lines up with a crossover, it provides an added layer of confirmation. This multi-indicator approach reduces the chance of being caught in fake breakouts, common in volatile markets.
Volume shows how many shares or contracts have traded in a given period, indicating the strength behind price moves. For candlestick patterns, high volume during a reversal pattern like a hammer or engulfing candle is a sign that many market participants back the move. Conversely, a pattern formed during low volume might be suspect or less reliable.
For instance, if Discovery Limited shares form a morning star pattern accompanied by a spike in volume, it often signals genuine buying interest and a potential trend change. Monitoring volume alongside candlestick patterns gives traders insight into market conviction and helps avoid costly misreads.
The Johannesburg Stock Exchange (JSE) features shares known for varying volatility levels, providing ideal examples of candlestick analysis in action. For example, an evening star pattern in Naspers shares following a sustained rally can hint at a coming decline. By studying these patterns on familiar names, traders can better understand how local factors affect price action and pattern reliability.
South African markets often experience sharp moves due to political events, currency fluctuations, or global shocks. In such volatile conditions, standard candlestick patterns might need adjusting. Traders should expect more frequent false signals and wait for additional confirmation, such as stronger volume or confluence with support and resistance levels.
For example, during Eskom load shedding-induced market jitters, a hammer candle might look promising but still require cross-checking against the overall market trend and volume spikes. Adapting a flexible approach rather than rigidly applying textbook patterns helps traders navigate local market quirks more effectively.
Combining candlestick patterns with volume and moving averages improves trade decisions. In South African markets, this blended approach accounts for local volatility and provides more dependable signals.
Understanding candlestick patterns can greatly improve your trading decisions, especially when you know how to avoid common pitfalls and use the right resources. This section highlights practical tips to help beginners make sense of candlestick analysis without falling into typical traps.
Candlestick patterns are not foolproof signals; they need context. A common mistake is to treat every pattern as an immediate buy or sell trigger. For example, spotting a hammer pattern doesn’t mean the price will instantly reverse upwards. It’s crucial to consider confirmation from the next candles or other technical indicators before acting. Incorrect interpretations can lead to premature decisions and losses.
Relying solely on candlesticks without looking at the bigger picture often leads to misguidance. Suppose the overall market trend on the Johannesburg Stock Exchange (JSE) is strongly bearish due to macroeconomic factors like a weak rand or international uncertainty. In such cases, bullish patterns might fail to follow through. Combining candlestick signals with broader market analysis or fundamental news will give you a well-rounded view and reduce the risk of false alarms.
Books by seasoned traders can sharpen your understanding. For instance, Steve Nison's "Japanese Candlestick Charting Techniques" remains a bestseller for a reason: it breaks down complex ideas into accessible lessons with real-life trading examples. South African traders might also find Patrick Mikula's "Swing Trading with Candlesticks" handy for its practical approach tailored to volatile markets.
Practising candlestick analysis using live data boosts learning. Charting websites like TradingView and South African brokerage platforms often include free candlestick chart tools with features like drawing patterns or adding moving averages. Some platforms even offer simulated trading environments where you can test your strategies without risking real money. These practical experiences help cement pattern recognition and improve your timing.
A savvier trader combines candle patterns with overall market trends and other indicators, avoiding knee-jerk moves and sharpening decision-making over time.
By steering clear of common misreads and investing in quality resources, you set yourself up for steadier progress in mastering candlestick analysis. Remember, no handful of patterns guarantees profits; consistent practice and staying informed are your best allies.
📈 Learn to spot bullish candlestick patterns on charts, understand market trends, and use practical tips with handy PDF summaries for smarter trading decisions.

📈 Learn how key candlestick patterns reveal market trends in forex trading. Master bullish & bearish signals plus tips for South African traders to boost your strategy.

📈 Learn to spot key forex trading patterns that reveal price moves, avoid common traps, and factor in market psychology for smarter decisions in volatile forex markets.

🔍 Learn to spot hammer candlestick patterns in trading, understand their variations, confirm signals, and apply practical tips for market reversal predictions.
Based on 15 reviews